
Watersheds
To assess U.S. water resources, the U.S. Geological Survey divides the nation into 22 hydrologic regions, or watersheds, based on the flow of water throughout the country. Each watershed represents a major river drainage area (e.g., the Missouri region) or combines rivers’ drainage areas (e.g., the Mid Atlantic Region includes the rivers that drain into the Atlantic Ocean between New York and Virginia).
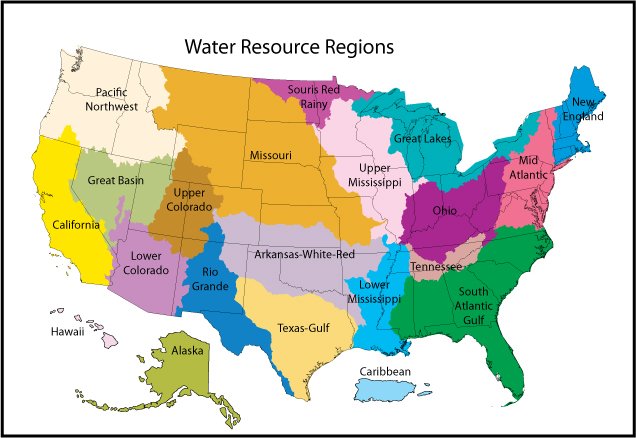
Source: USGS Science in Your Watershed
Note that the South Pacific region, consisting of Guam, the Northern Mariana Islands, and American Samoa, is not shown on this map.
Hydrologic regions are connected by the complex movement of water, such as rainwater that drains into streams that flow into rivers. Chemicals released to land far from any lakes, rivers, or oceans, can eventually be carried a water body. Releases to air, land, or water can all end up impacting fish, wildlife, and other living things that depend on a water body.
Certain chemicals remain in the environment for a long time after they are released and can build up in the tissues of wildlife living in or drinking contaminated water in a process called bioaccumulation. These chemicals can become more concentrated as predators farther up the food chain eat organisms lower on the food chain which can cause health problems for wildlife and humans.
All 22 watersheds are displayed on the Where You Live map. The chart below shows the ten watersheds with the most TRI chemical releases in 2023. Releases were highest in the Alaskan and Great Basin regions. In these regions, most releases were from metal mines.
Note: Chart shows the ten watersheds with the most TRI chemical releases in pounds.
The chart below shows the ten watersheds with the most TRI chemical releases per square mile. Releases per square mile were greatest in the Great Basin region, which encompasses much of Nevada and Utah. Releases from metal mines made up 91% of the releases in this region.
Note: Chart shows the ten watersheds with the most TRI chemical releases in pounds per square mile.
This page was published in August 2025 and uses the 2023 TRI National Analysis dataset made public in TRI Explorer in October 2024.