U.S. flag

An official website of the United States government

Here’s how you know

Dot gov

Official websites use .gov
A .gov website belongs to an official government organization in the United States.

HTTPS

Secure .gov websites use HTTPS
A lock (LockA locked padlock) or https:// means you’ve safely connected to the .gov website. Share sensitive information only on official, secure websites.

    • Environmental Topics
    • Air
    • Bed Bugs
    • Cancer
    • Chemicals, Toxics, and Pesticide
    • Emergency Response
    • Environmental Information by Location
    • Health
    • Land, Waste, and Cleanup
    • Lead
    • Mold
    • Radon
    • Research
    • Science Topics
    • Water Topics
    • A-Z Topic Index
    • Laws & Regulations
    • By Business Sector
    • By Topic
    • Compliance
    • Enforcement
    • Laws and Executive Orders
    • Regulations
    • Report a Violation
    • Environmental Violations
    • Fraud, Waste or Abuse
    • About EPA
    • Our Mission and What We Do
    • Headquarters Offices
    • Regional Offices
    • Labs and Research Centers
    • Planning, Budget, and Results
    • Organization Chart
    • EPA History

Breadcrumb

  1. Home
  2. Causal Analysis/Diagnosis Decision Information System (CADDIS)

Computing Inferences: Weighted Average Inferences

  • Introduction
  • Using Taxon-Environment Relationships
  • Estimating Taxon-Environment Relationships
  • Computing Inferences
  • R Scripts
Helpful Links
Topics In Computing Inferences
  • Overview 
  • Weighted Average Inferences
  • Maximum Likelihood Inferences
  • Categorical Tolerance Data

PECBO Appendix Site Map

Weighted Average Inferences

A weighted average inference is computed as the average of the single-value descriptors of the taxa observed at the site. A single-value descriptor of a taxon-environment relationship can quantify the central tendencies of a taxon with respect to an environmental gradient or the environmental limits of a taxon.

The computation of weighted average inference can be expressed as in Equation 9:

EQUATION 9
EQUATION 9

where um,i  is the weighted average inference at site i, N is the number of taxa, and uj is the single-value descriptor for taxon j. Yij  is defined as previously: for presence/absence data, Yij = 1 when a taxon j is present, and Yij = 0 when taxon j is absent from site i; for abundance data Yij  is the abundance of taxon j at site i.


Relationship between weighted average inferences of temperature and observed temperature in Oregon.
Figure 15. Relationship between weighted average inferences of temperature and observed temperature in Oregon. Solid line shows position of a smoothing spline fit through the data. Temperature on both axes in units of °C.
An example of a weighted average inference is shown in Figure 15. Central tendencies for different genera were computed with regard to stream temperature using EMAP-West data. Then, these values were used to compute the weighted average inferences at sites in an independent dataset, collected from western Oregon. The weighted average inference at each site was plotted versus stream temperature measured at the same site.

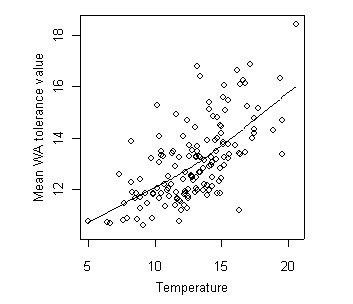
The relationship between the weighted average inferences and observed temperature is relatively strong. Note though that the range of possible values of the weighted average inference is much narrower than the observed range. This "shrinkage" in the range of values is a consequence of the averaging operations that have been applied to compute the central tendencies of each taxon and to compute the inference.

Causal Analysis/Diagnosis Decision Information System (CADDIS)

  • CADDIS Home
    • About CADDIS
    • Frequent Questions
    • Publications
    • Recent Additions
    • Related Links
    • CADDIS Glossary
  • Volume 1: Stressor Identification
    • About Causal Assessment
    • Getting Started
    • Step 1. Define the Case
    • Step 2. List Candidate Causes
    • Step 3. Evaluate Data from the Case
    • Step 4. Evaluate Data from Elsewhere
    • Step 5. Identify Probable Causes
  • Volume 2: Sources, Stressors and Responses
    • About Sources
      • Urbanization
    • About Stressors
  • Volume 3: Examples and Applications
    • Analytical Examples
    • Worksheet Examples
    • State Examples
    • Case Studies
    • Galleries
  • Volume 4: Data Analysis
    • Selecting an Analysis Approach
    • Getting Started
    • Basic Principles & Issues
    • Exploratory Data Analysis
    • Basic Analyses
    • Advanced Analyses
    • PECBO Appendix
    • Download Software
    • Data Analysis Topics (A -Z)
  • Volume 5: Causal Databases
    • Learn about CADLink
Contact Us about CADDIS
Contact Us to ask a question, provide feedback, or report a problem.
Last updated on February 7, 2025
  • Assistance
  • Spanish
  • Arabic
  • Chinese (simplified)
  • Chinese (traditional)
  • French
  • Haitian Creole
  • Korean
  • Portuguese
  • Russian
  • Tagalog
  • Vietnamese
United States Environmental Protection Agency

Discover.

  • Accessibility Statement
  • Budget & Performance
  • Contracting
  • EPA www Web Snapshot
  • Grants
  • No FEAR Act Data
  • Plain Writing
  • Privacy
  • Privacy and Security Notice

Connect.

  • Data
  • Inspector General
  • Jobs
  • Newsroom
  • Regulations.gov
  • Subscribe
  • USA.gov
  • White House

Ask.

  • Contact EPA
  • EPA Disclaimers
  • Hotlines
  • FOIA Requests
  • Frequent Questions
  • Site Feedback

Follow.