
Manipulation of Exposure at Other Sites
Concept
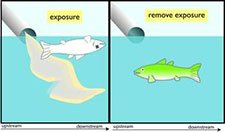
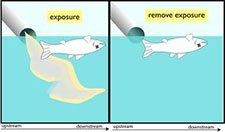
Manipulation of Exposure at Other Sites: At similarly impacted locations outside the case sites, field experiments or management actions that increase or decrease exposure to a cause must increase or decrease the biological effect.
Click for more information
Click for more information
Examples
Consider increased total suspended solids (TSS) loadings from a pulp mill as a candidate cause of reduced mayfly (Ephemeroptera) abundance in a river. What findings support or weaken the case for increased TSS as the cause, based on manipulation of exposure at other sites?
- Supporting evidence - In a similar river in the same ecoregion, mayfly abundance increased dramatically when a pulp mill (similar to the one upstream of the impaired site) reduced its TSS loadings to the river.
- Weakening evidence - In a similar river in the same ecoregion, mayfly abundance remained low when a pulp mill (similar to the one upstream of the impaired site) reduced its TSS loadings to the river.
How Do I Analyze the Data?
The most compelling manipulations are controlled field experiments at other sites, that involve elimination or reduction of exposure to a source (e.g., fencing cattle out of a stream) or a stressor (e.g., adding large woody debris to a stream), or artificial inducement of exposure to a stressor (e.g., placing caged organisms at sites with varying levels of the stressor). Ideally, changes in both the proximate stressor and the observed biological effect should be measured after manipulation. The power of this type of evidence comes from the control of exposure achieved by deliberate manipulation of events, and even the potential for replication. However, uncontrolled experiments (e.g., elimination of effluent during facility shutdown) also can be useful.
Statistical techniques used to evaluate manipulation of exposure include time series analysis; statistical tests such as the t-test, when manipulations are replicated and randomized; and methods based on rare events, such as the reappearance of sensitive taxa. Uncertainty in the data can be introduced when other events, natural factors, or other causes co-occur with the variable being manipulated; sampling designs such as before-after-control-impact (BACI) can help control for some of these factors. Additional uncertainties include potential recovery rates and treatment effectiveness, and these factors should be taken into account when analyzing results.
A key step in this type of evidence is explicit comparison of the manipulated sites and the impaired site in terms of physical conditions, biota, and other characteristics. Extrapolation and fate and transport models can be used to quantify differences between the sites, allowing for more accurate extrapolation of results to the impaired sites.
What Evidence Would Support or Weaken the Case for a Candidate Cause?
- Data from other sites showing that the effect decreases when or where exposure to the candidate cause is eliminated or reduced
- Data from other sites showing that the effect appears or increases when or where exposure to the candidate cause starts or increases
- Data from other sites showing that the effect persists when exposure to the candidate cause is removed is eliminated
- Data from other sites showing that the effect does not occur when exposure to the candidate cause starts
How Do I Score the Evidence?
| Finding | Interpretation | Score |
|---|---|---|
| At other sites, the effect is consistently eliminated or reduced when exposure to the candidate cause is eliminated or reduced, OR the effect consistently starts or increases when exposure to the candidate cause starts or increases. | This finding convincingly supports the case for the candidate cause, because consistent results of manipulations at many sites are unlikely to be due to chance or irrelevant to the site being investigated. | +++ |
| At other sites, the effect is eliminated or reduced at most sites when exposure to the candidate cause is eliminated or reduced, OR the effect starts or increases at most sites when exposure to the candidate cause starts or increases. | This finding somewhat supports the case for the candidate cause, but is not strongly supportive because consistent results of manipulation at one or a few sites may be coincidental or irrelevant to the site being investigated. | + |
| Changes in the effect after manipulation of the candidate cause are ambiguous. | This finding neither supports nor weakens the case for the candidate cause. | 0 |
| At other sites, the effect is not consistently eliminated or reduced when exposure to the cause is eliminated or reduced, OR the effect does not consistently start or increase when exposure to the cause starts or increases. | This finding strongly weakens the case for the candidate cause, but is not convincing because failure to eliminate or induce effects at one or a few sites may be due to poorly conducted studies, or results may be irrelevant due to differences among sites. | -- |
Helpful Tips
- While individual studies may represent unreplicated or incompletely replicated experiments, multiple studies conducted at different sites provide replication. However, even individual studies can be convincing and point to solutions when the causal analysis is completed.
- Note that it is not possible to refute the case for a candidate cause using evidence based on manipulation of exposure at other sites.