Incremental Evaluation of CMAQv5.3
Over the last two decades, new versions of the CMAQ model have been periodically released. Each new version consists of multiple updates to the model’s scientific algorithms and input data quality. Since CMAQ is used by the USEPA, as well as State and Regional offices, to estimate criteria pollutant (e.g. ozone, O3; fine particulate matter, PM2.5) concentrations, each new release requires a comprehensive evaluation to establish model credibility for a wide range of applications. The CMAQ modeling system version 5.3 (v5.3) was tested and evaluated against observations and was publicly released in August 2019. CMAQ version 5.3.1 and 5.3.2 were released as minor updates to v5.3 in December 2019 and October 2020, respectively.
Major Updates to the CMAQv5.3+ Modeling System
- New aerosol module (AERO7) with significant updates to secondary organic aerosol (SOA) chemistry
- Updated chlorine chemistry
- Updated detailed bromine/iodine chemistry
- Updated simple halogen chemistry
- Addition of dimethyl sulfide (DMS) chemistry in the CB6r3 chemical mechanism
- Updated M3Dry bi-directional deposition model
- New Surface Tiled Aerosol and Gaseous Exchange (STAGE) bi-directional deposition model
- New Detailed Emissions Scaling, Isolation, and Diagnostic (DESID) module
- Added ability to read multiple gridded emissions files
- The Integrated Source Apportionment Method (ISAM) has been updated to greatly improve speed and accuracy
Incremental Testing of CMAQv5.3
Evaluation of CMAQv5.3.1 was performed by comparing monthly and seasonal mean daily 8-hr average (MDA8) O3 and PM2.5 values from several CMAQv5.3.1 simulations to a similarly configured CMAQv5.2.1 simulation for 2016. Model values are compared to observations acquired from the USEPA’s Air Quality System (AQS) and from Environment and Climate Change Canada's National Air Pollution Surveillance (NAPS) network. All simulations were over the contiguous US (CONUS) using a 12km horizontal grid resolution and 35 vertical layers. Configuration details, including model inputs, are documented in Appel et al. (2021). Below are select highlights from the more in depth evaluation described in Appel et al.
Ozone
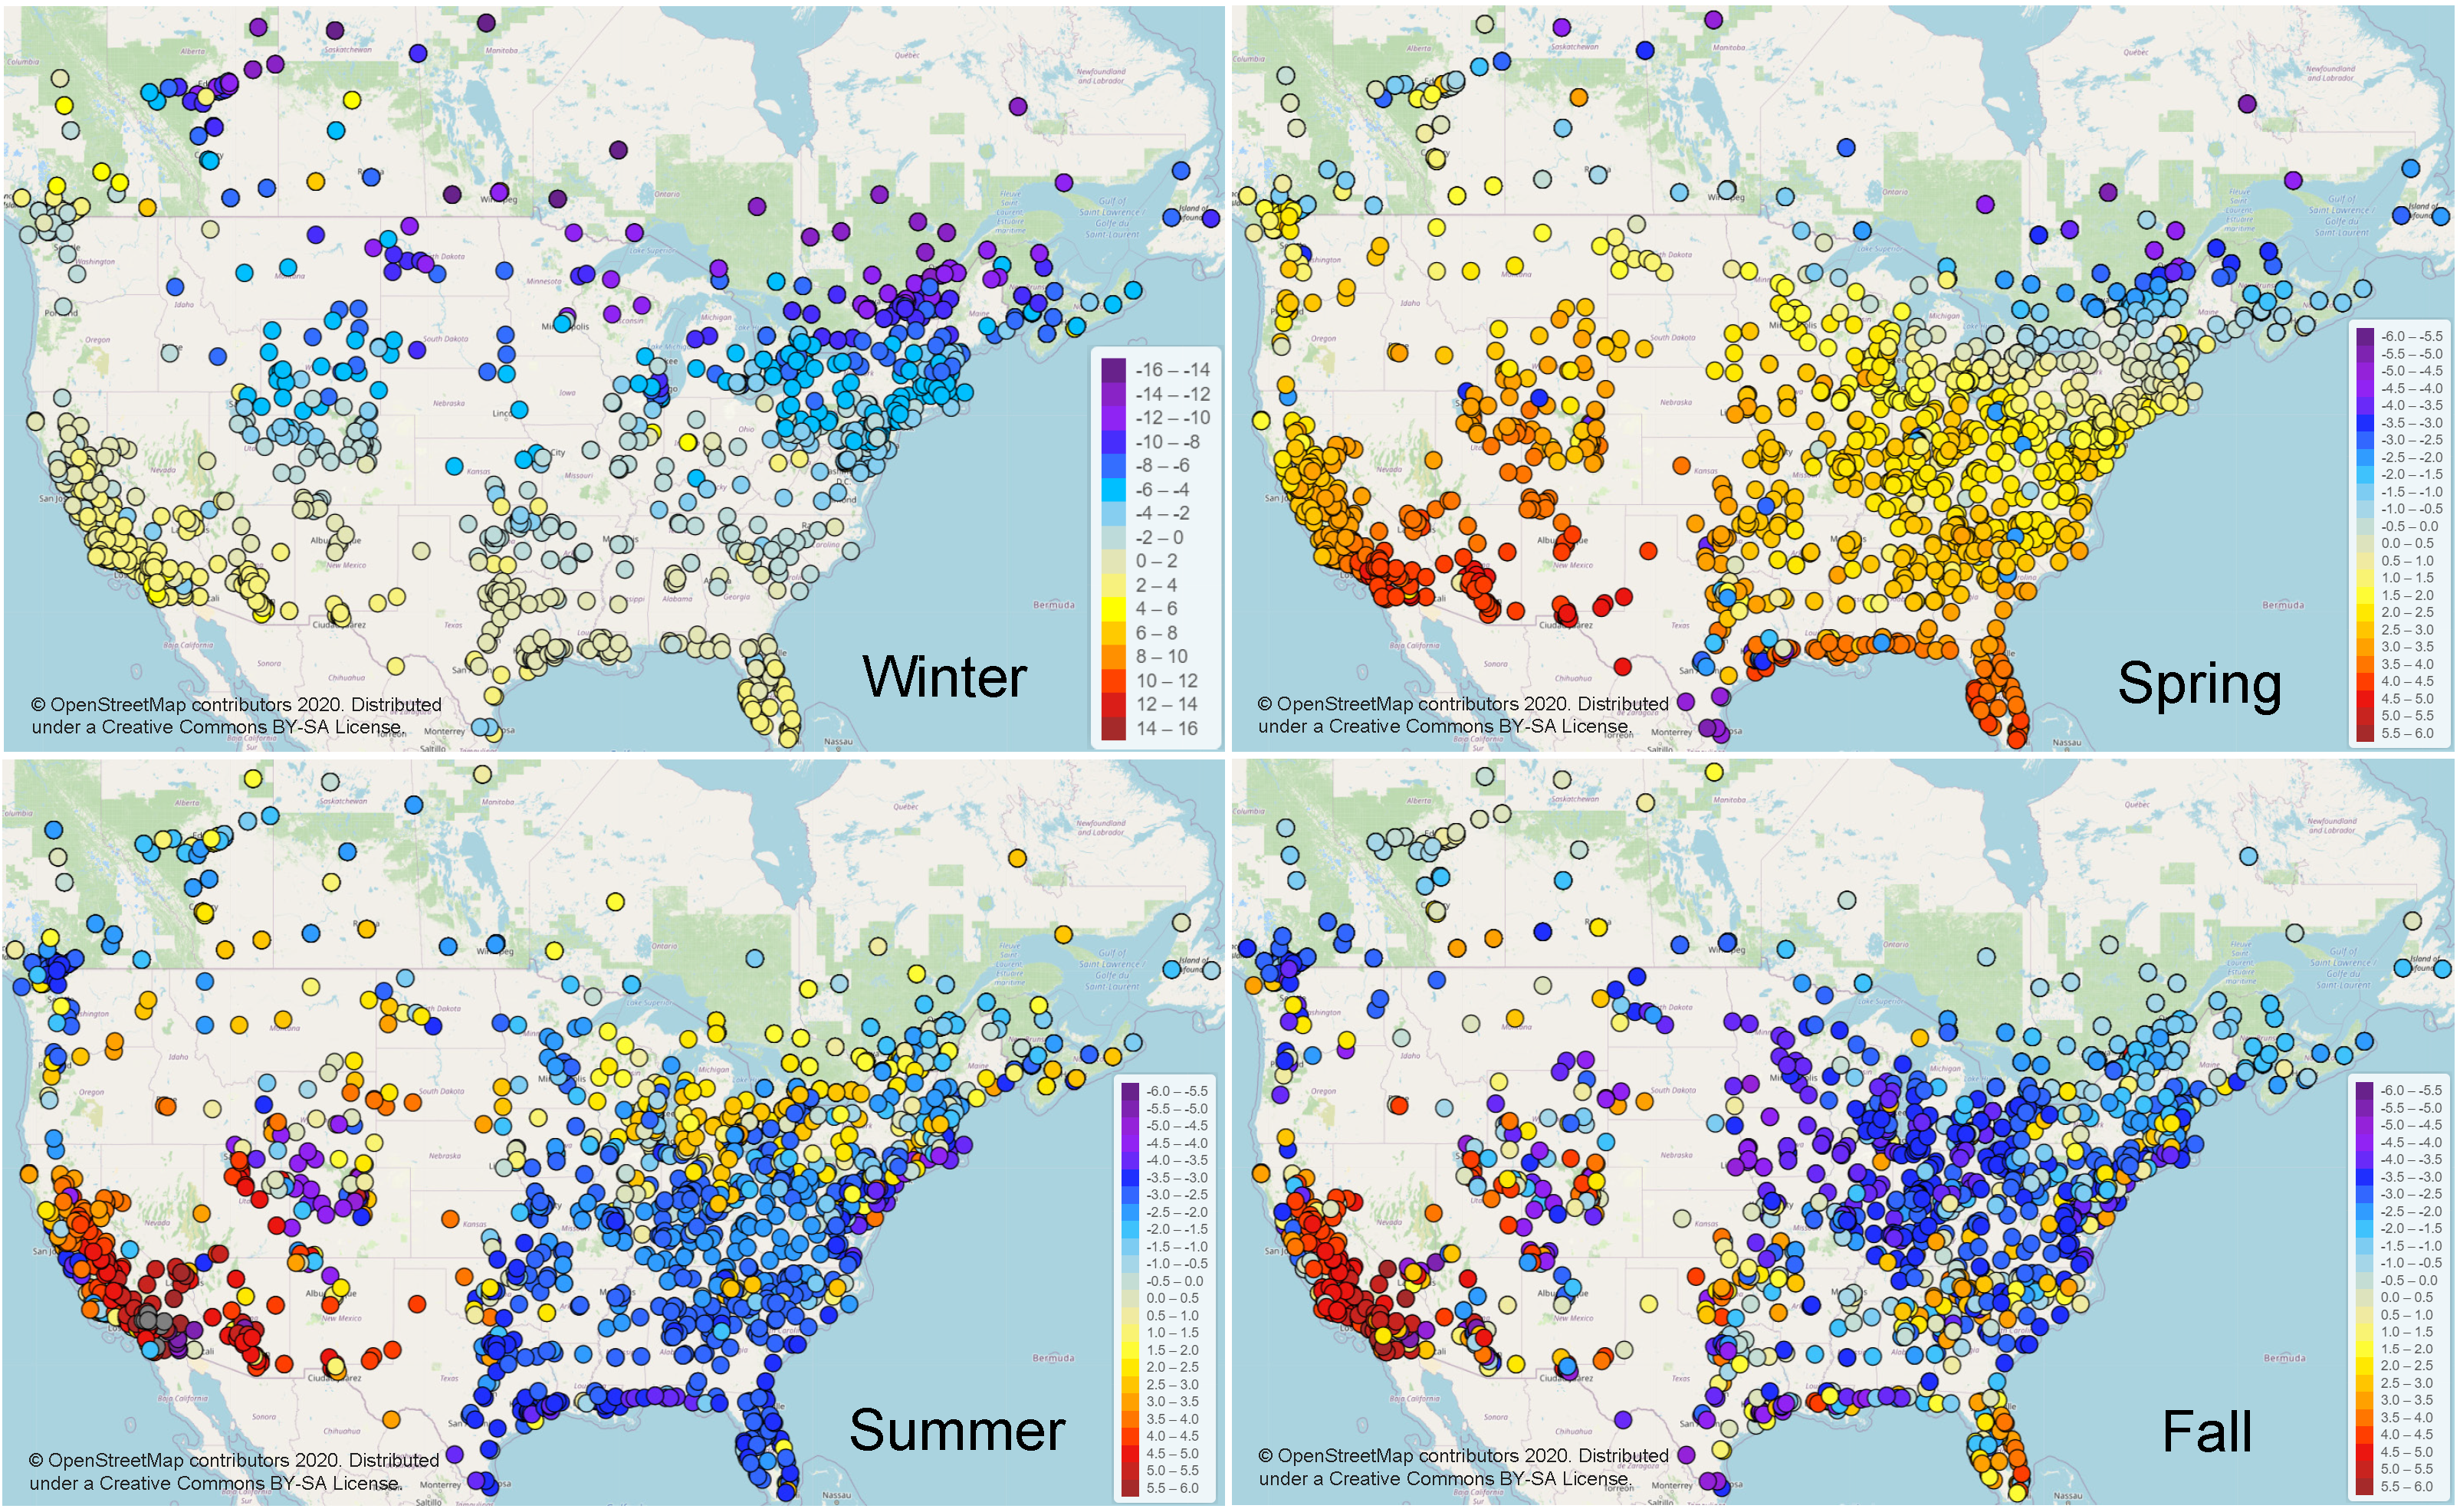
- Ozone is found to be higher (~2 ppbV on average across all AQS sites) in the winter (December/January); and lower (~2 ppbV on average across all sites) in the spring, summer and fall in CMAQv5.3.1 compared to v5.2.1.
- Science updates affecting O3 had the overall effect of dramatically improving O3 underestimation in the winter (particularly the northern latitudes), slightly increasing O3 overestimation in the spring, reducing O3 bias in the summer and fall in the eastern US, and increasing O3 bias in the summer and fall in the western US, particularly California (except for along the coast where O3 bias decreases). The increase in ozone bias in the spring is mainly the result of increased ozone from the boundaries.

PM2.5
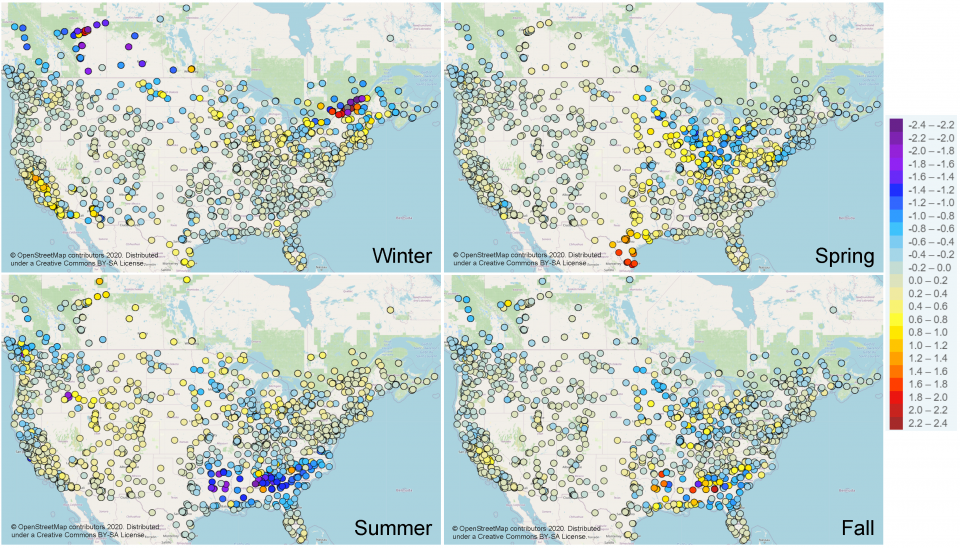
- PM2.5 is slightly lower (~0–0.5 µg m-3 on average across all sites) in the late fall, winter and early spring; and higher (~0.5–1 µg m-3 on average across all sites) in late spring, summer and early fall.
- As the overall change in PM2.5 in the winter was close to zero, overall model performance did not change much, with changes in mean bias between -2 to 2 µg/m3. Change in performance in the spring was also relatively small, although there was a slight overall increase in bias in the Southeast US, generally on the order of 2 µg m-3 or less. Bias increased more significantly in the summer and fall in the Southeast US, with mean bias value increasing between 2-4 µg/m3 (particularly in the summer). Elsewhere across the country, change in bias was generally small, with some notable isolated exceptions along the west coast.

References
Appel, K. W., Bash, J. O., Fahey, K. M., Foley, K. M., Gilliam, R. C., Hogrefe, C., Hutzell, W. T., Kang, D., Mathur, R., Murphy, B. N., Napelenok, S. L., Nolte, C. G., Pleim, J. E., Pouliot, G. A., Pye, H. O. T., Ran, L., Roselle, S. J., Sarwar, G., Schwede, D. B., Sidi, F. I., Spero, T. L., and Wong, D. C.: The Community Multiscale Air Quality Model Version 5.3 and 5.3.1: System Updates and Evaluation, Geosci. Model Dev. (2021) https://doi.org/10.5194/gmd-14-2867-2021
