
EQUATES
Table of Content
- EQUATES Overview
- How to download EQUATES data
- Model Domains
- Meteorology modeling
- Emissions modeling
- CMAQ Modeling
- EQUATES Applications
- References
EQUATES: EPA’s Air QUAlity TimE Series Project
EPA scientists have developed a set of modeled meteorology, emissions, air quality and pollutant deposition spanning the years 2002 through 2019. Modeled datasets cover the Conterminous U.S. (CONUS) at a 12km horizontal grid spacing and the Northern Hemisphere at a 108km grid spacing using the Weather Research and Forecasting (WRF) model version 4.1.1 for simulating weather conditions and EPA’s Community Multiscale Air Quality (CMAQ) model version 5.3.2 for air quality modeling. New hemispheric and North American emissions inventories were developed using, to the extent possible, consistent input data and methods across all years, including emissions from motor vehicles, fires, and oil and gas sources.
Decadal CMAQ simulations have been used for epidemiological studies, critical loads analyses, and to understand local and global air quality trends. EQUATES supersedes previous CMAQ time series and provides a unified set of modeling data in order to:
- Reduce artificial step changes in model estimates due to changes in methodology, e.g., input data, processing methods, model versions
- Provide information on trends in criteria pollutants (e.g., ozone, particulate matter, nitrogen oxides) for epidemiologists
- Provide information on deposition trends for EPA’s EnviroAtlas, the National Atmospheric Deposition Program’s Total Deposition (NADP TDep) maps and grids, and to support critical loads studies and nutrient assessments
- Facilitate dynamic and diagnostic model evaluation with consistent modeling data and provide a base modeling platform for sensitivity simulations to support model development
- Share modeling datasets on a public online platform so that collaborators in and outside of EPA can leverage the modeling products for their work
For questions about the EQUATES project please click on the CONTACT US link at the top of the page.
How to Download EQUATES Data
EQUATES meteorology, emissions, and air quality modeling datasets have been packaged to meet various collaborator needs and are available to download from the CMAS Data Warehouse. EQUATES data are also available to subset, visualize, and download from EPA's Remote Sensing Information Gateway (RSIG).
Model Domains
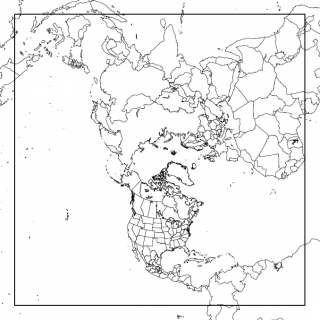
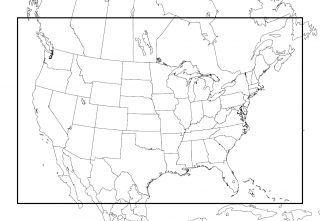
The EQUATES emissions, meteorology, and air quality modeling was performed on two domains: the Northern Hemisphere 108-km domain ("108NHEMI") and the contiguous U.S. (CONUS) 12-km domain ("12US1"). Model output from the 108NHEMI CMAQ simulations provided boundary conditions for the 12US1 CMAQ simulations. This approach creates consistency in the modeling of the meteorology and chemistry at the global and regional scale. Improving model boundary conditions impacts air pollutant estimates over the U.S. Changes in boundary conditions can have a significant impact on pollutant concentrations well into the CONUS domain through different inflow particles, or through changes in chemistry due to different inflow of gas phase species.
Meteorology Modeling
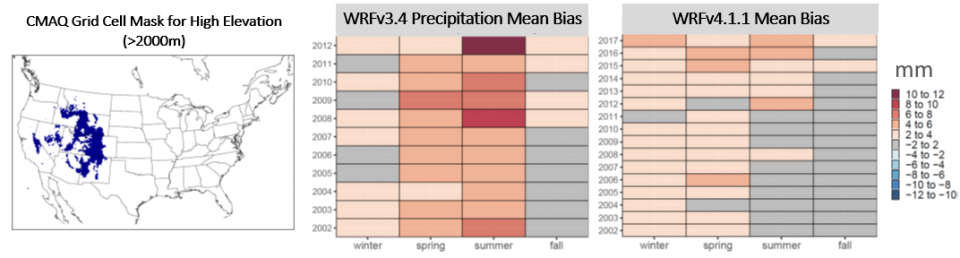
The meteorology modeling for both the 12US1 and 108NHEMI domain was done with the Weather Research and Forecasting (WRF) model version 4.1.1. The WRF simulations were evaluated against surface observations from the Meteorological Assimilation and Data Ingest System (MADIS) of the National Oceanic and Atmospheric Administration (NOAA). Upper air meteorology was evaluated against global radiosonde measurements. Evaluation showed WRFv4.1.1 performed as well as, or better than previous model versions. In addition, the WRF simulations utilized a new hybrid vertical coordinate system (Beck et al. 2020) which reduced the overestimation of precipitation at high elevation locations in western states compared to previous WRF versions.
Emissions Modeling
Previous decadal and multi-decadal CMAQ simulations, e.g., Zhang et al., 2019, used emissions datasets from different National Emissions Inventories (NEIs) or used a base year NEI and estimated emissions for other years by creating scaling factors based on activity data and emission control information (Xing et al., 2013). The EQUATES emissions data were developed using, to the extent possible, consistent input data and methods across all years. This approach was taken to avoid artificial step-changes in emissions and air quality estimates due to changes in methodology that do not reflect real-world phenomena.
The EQUATES base year emissions are from the 2017 NEI. For each sector in the 2017 NEI one of four approaches was applied to estimate emissions for the entire 2002-2019 time period:
- Develop new methods for creating consistent emissions for all years
- Use 2016 or 2017 model platform emissions and create scaling factors based on activity data and/or emission control information
- Use existing modeling platform data for earlier years (2002-2015) and later years (2018-2019)
- Leave emissions flat at 2017 NEI levels
Foley et al (2023) provides a summary of the emissions modeling methods used for each source category 12US1 domain. Important emissions updates in EQUATES include:
- The use of EPA's MOtor Vehicle Emissions Simulator version 3 (MOVES3) for onroad emissions modeling
- Consistent fire emissions inventories described in Pouliot et al. (2020)
- Consistent oil and gas emissions using the EPA's Oil and Gas Emission Estimation Tool
- New fertilizer emissions based on the Environmental Policy Integrated Climate (EPIC) model to support CMAQv5.3.2 modeling of bidirectional exchange of ammonia
- New volatile chemical product (VCP) emissions following Seltzer et al. (2021)
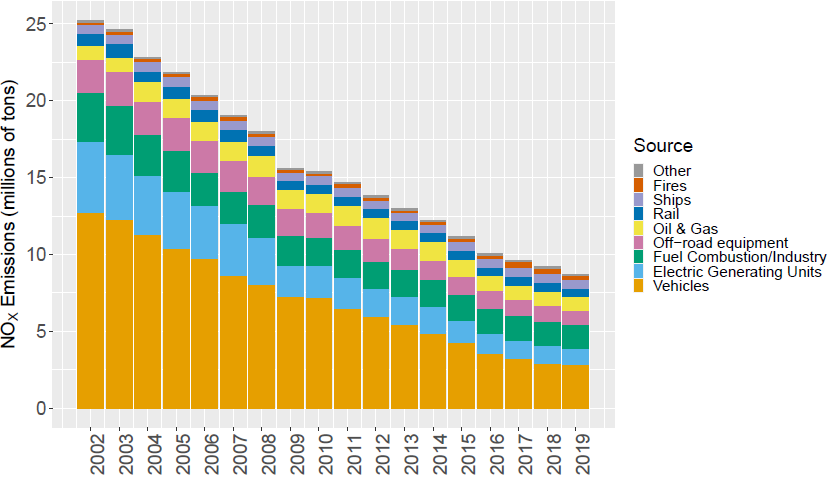
The final set of emissions inventories can be used to summarize emissions trends across years, states, and sectors, and provides a valuable set of air quality model inputs for new modeling applications. For example, the trend plot below shows the steady decrease in annual total U.S. emissions of nitrogen oxides (NOX) from motor vehicles and power plants (electric generating units) from 2002 to 2019.
Meta data for the 108NHEMI domain are available in the Technical Support Document for EQUATES Northern Hemisphere emissions.
CMAQ Modeling
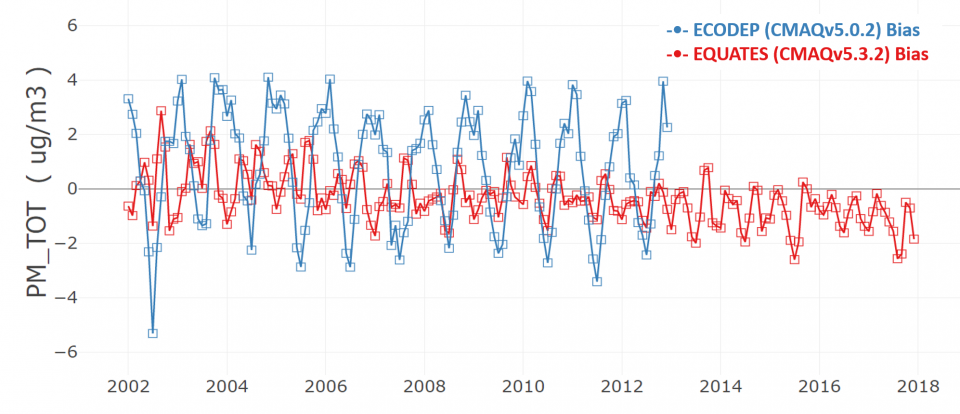
Air quality modeling for EQUATES is based on CMAQv5.3.2 and includes extensive science updates compared to modeling done for past CMAQ timeseries such as the 'ECODEP' project which was based on CMAQv5.0.2. For example, improvements to the aerosol module between v5.0.2 and v5.3.2 have led to substantial improvement in model estimated PM2.5. The high winter bias and low summer bias in the CMAQv5.0.2 timeseries is reduced in the new EQUATES simulations, as shown in the bias plot below. See Appel et al. (2021) for additional evaluation of the CMAQv5.3+ system. Initial evaluation of EQUATES 108NHEMI and CONUS CMAQ simulations is available in the presentations by Hogrefe et al. (2021) and Foley et al. (2021), respectively.
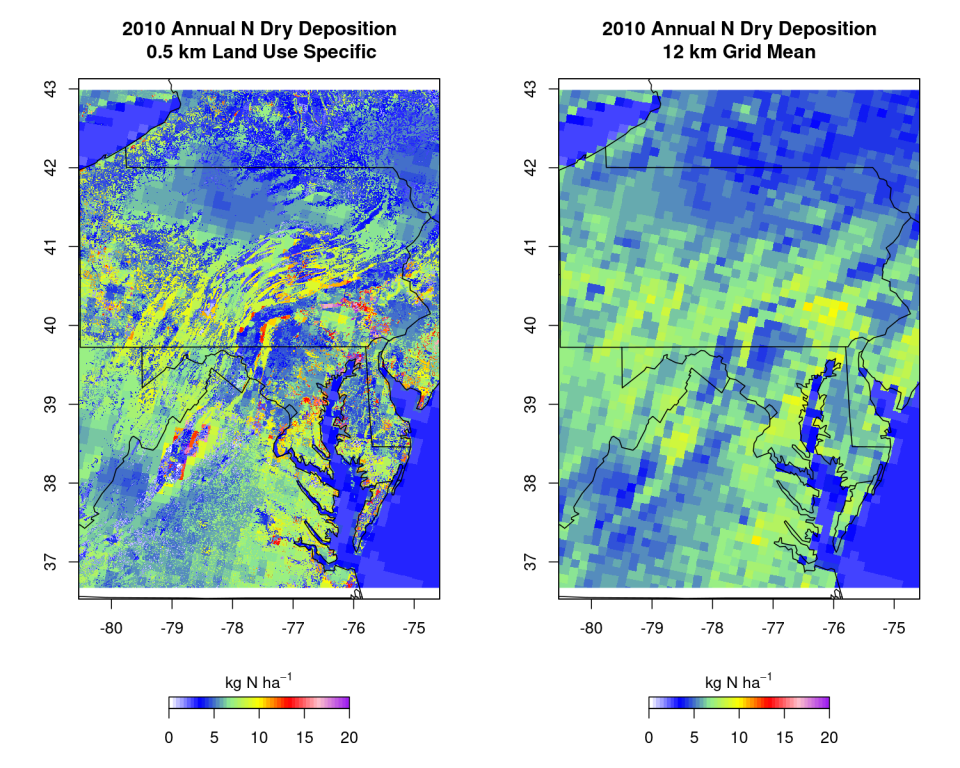
EQUATES also includes substantial updates to the modeling of acid deposition compared to previous CMAQ simulations. The Surface Tiled Aerosol and Gaseous Exchange (STAGE) dry deposition option in CMAQ v5.3 (Bash et al., 2018; Galmarini et al., 2021) was used to estimate deposition at 0.5 km resolution. High-resolution deposition modeling allows for better integration into ecosystem models and improved estimates for critical load analyses along coastlines and areas with diverse land use.
EQUATES Applications
The EQUATES modeling datasets have been used to support a wide range of applications. The following links provide references for journal articles and presentations by EPA authors that leverage EQUATES data.
- Journal articles with EPA authors that use EQUATES data
- Presentations by EPA authors that use EQUATES data
References
Appel, K. W., Bash, J. O., Fahey, K. M., Foley, K. M., Gilliam, R. C., Hogrefe, C., Hutzell, W. T., Kang, D., Mathur, R., Murphy, B. N., Napelenok, S. L., Nolte, C. G., Pleim, J. E., Pouliot, G. A., Pye, H. O. T., Ran, L., Roselle, S. J., Sarwar, G., Schwede, D. B., Sidi, F. I., Spero, T. L., and Wong, D. C. (2021) The Community Multiscale Air Quality Model Version 5.3 and 5.3.1: System Updates and Evaluation, Geosci. Model Dev. https://doi.org/10.5194/gmd-14-2867-2021
Bash, J., Walker, J., Schwede, D., Campbell, P., Spero, T., Appel, W., Shephard, M., Cady-Pereira, K., Pinder, R., Pye, H., Murphy, B., Fahey, K. (2018) Introducing the Surface Tiled Aerosol and Gaseous Exchange (STAGE) Dry Deposition Option for CMAQ V5.3, 19th Annual CMAS Conference, Oct 24, 2018, Chapel Hill, NC. Presentation link: https://www.cmascenter.org/conference//2018/slides/0910_bash_introducting_surface_2018.pptx
Beck, J., Brown, J., Dudhia, J., Gill, D., Hertneky, T., Klemp, J., Wang, W., Williams, C., Hu, M., James, E., Kenyon, J., Smirnova, T., & Kim, J. (2020). An Evaluation of a Hybrid, Terrain-Following Vertical Coordinate in the WRF-Based RAP and HRRR Models, Weather and Forecasting, 35(3), 1081-1096. doi: https://doi.org/10.1175/WAF-D-19-0146.1
Benish, S. E., Bash, J. O., Foley, K. M., Appel, K. W., Hogrefe, C., Gilliam, R., and Pouliot, G. (2022) Long-term regional trends of nitrogen and sulfur deposition in the United States from 2002 to 2017, Atmos. Chem. Phys., 22, 12749--12767, https://acp.copernicus.org/articles/22/12749/2022.
Foley, K. M., Pouliot, G. A., Eyth, A., Aldridge, M. F., Allen, C., Appel, K. W., Bash, J. O., Beardsley, M., Beidler, J., Choi, D., Farkas, C., Gilliam, R. C., Godfrey, J., Henderson, B. H., Hogrefe, C., Koplitz, S. N., Mason, R., Mathur, R., Misenis, C., Possiel, N., Pye, H. O. T., Reynolds, L., Roark, M., Roberts, S., Schwede, D. B., Seltzer, K. M., Sonntag, D., Talgo, K., Toro, C., Vukovich, J., Xing, J., and Adams, E. (2023). 2002-2017 Anthropogenic Emissions Data for Air Quality Modeling over the United States. Data in Brief 109022, https://doi.org/10.1016/j.dib.2023.109022.
Foley, K., Pouliot, G., Eyth, A., Possiel, N., Aldridge, M., Allen, C., Appel, W., Bash, J., Beardsley, M., Beidler, J., Choi, D., Eder, B., Farkas, C., Gilliam, R., Godfrey, J., Henderson, B., Hogrefe, C., Koplitz, S., Mason, R., ... Vukovich, J. (2021) EQUATES: EPA's Air QUAlity TimE Series Project, 20th Annual CMAS Conference, Nov 2, 2020, (virtual). Presentation link (Google Drive link).
Foley, K., Pouliot, G., Eyth, A., Possiel, N., Aldridge, M., Allen, C., Appel, W., Bash, J., Beardsley, M., Beidler, J., Choi, D., Eder, B., Farkas, C., Gilliam, R., Godfrey, J., Henderson, B., Hogrefe, C., Koplitz, S., Mason, R., ... Vukovich, J. (2020) EQUATES: EPA's Air QUAlity TimE Series Project, 19th Annual CMAS Conference, Oct 28, 2020, (virtual). Presentation link: https://www.cmascenter.org/conference/2020/slides/KFoley_EQUATES_CMAS_2020.pdf
Galmarini, S., Makar, P., Clifton, O., Hogrefe, C., Bash, J., Bellasio, R., Bianconi, R., Bieser, J., Butler, T., Ducker, J., Flemming, J., Hodzic, A., Holmes, C., Kioutsioukis, I., Kranenburg, R., Lupascu, A., Perez-Camanyo, J., Pleim, J., Young-Hee Ryu, Y.-H., ..., Wolke, R. (2021) Technical note: AQMEII4 Activity 1: evaluation of wet and dry deposition schemes as an integral part of regional-scale air quality models, Atmos. Chem. Phys., 21, 15663-15697, doi: https://doi.org/10.5194/acp-21-15663-2021
Hogrefe, C., Gilliam, R., Mathur, R., Henderson, B., Sarwar, G., Appel, K.W., Pouliot, G., Willison, J., Miller, R., Vukovich, J., Eyth, A., Talgo, K., Allen, C., Foley, K. (2021) CMAQv5.3.2 ozone simulations over the Northern Hemisphere: model performance and sensitivity to model configuration, 20th Annual CMAS Conference, Nov 2, 2020, (virtual). Presentation link: https://www.cmascenter.org/conference/2021/slides/hogrefe-cmaq5-3-2-ozone-2021.pdf
Pouliot, G., Foley, K., Beidler, J., Vukovich, J., Baker, K. (2020) Multi-Year Reanalysis of EPA's Fire Emissions Inventory, 19th Annual CMAS Conference, Oct 28, 2020, (virtual). Presentation link: https://www.cmascenter.org/conference/2020/slides/Pouliot_CMAS2020_EQUATES-fireEmissions.pdf
Simon, H., Appel, W., Foley, K., Henderson, B., Hogrefe, C., Liljegren, J., Koplitz, S., Possiel, N., Tonneson, G., Valin, G., Wells, B., Whitehill, A. (2024) Modeled and observed 2002-2019 trends in ozone day-of-week patterns across US nonattainment areas, ACP, 24, 1855-187, https://doi.org/10.5194/acp-24-1855-2024.
Seltzer, K. M., Pennington, E., Rao, V., Murphy, B. N., Strum, M., Isaacs, K. K., and Pye, H. O. T. (2021) Reactive Organic Carbon Emissions from Volatile Chemical Products, Atmos. Chem. Phys., 21, 5079-5100, doi: https://doi.org/10.5194/acp-21-5079-2021
Skipper, T.N., Hogrefe, C., Henderson, B.H., Mathur, R., Foley, K.M., Russell, A.G. (2024) Source specific bias correction of US background ozone modeled in CMAQ, under final review at EGUsphere, https://doi.org/10.5194/egusphere-2024-554.
US EPA, Technical Support Document for EQUATES Northern Hemisphere emissions.
Wilkie, A.A., Luben, T.J., Rappazzo, K., Foley, K., Woods, C.G., Serre, M.L., Richardson, D.B., Daniels, J.L. (2024) Ambient sulfur dioxide exposure during gestation and preterm birth in North Carolina, 2003-2015. Atmospheric Environment, 333, 120669, https://doi.org/10.1016/j.atmosenv.2024.120669.
Xing, J., Pleim, J., Mathur, R., Pouliot, G., Hogrefe, C., Gan, C.-M., &Wei,C. (2013). Historical gaseous and primary aerosol emissions in the United States from 1990 to 2010. Atmospheric Chemistry and Physics, 13, 7531-7549. doi: https://doi.org/10.5194/acp-13-7531-2013
Zhang, Y., Foley, K. M., Schwede, D. B., Bash, J. O., Pinto, J. P., & Dennis, R. L. (2019). A Measurement-Model Fusion Approach for Improved Wet Deposition Maps and Trends. Journal of Geophysical Research: Atmospheres, 124(7), 4237-4251. doi: https://agupubs.onlinelibrary.wiley.com/doi/10.1029/2018JD029051