
Hemispheric Scale Applications
As air quality standards are tightened, the need to quantify the contributions of long-range transport on local pollution becomes increasingly important. Atmospheric chemistry and transport of trace species occur across the continuum of spatial and temporal scales. For instance, transport across intercontinental to hemispheric scales occurs over timescales ranging from days to months, which influences the distribution of trace species with lifetimes within this range. Transport on these scales can also influence shorter lived radical budgets through chemical reactions involving intermediate-lived species, especially reservoir species such as organic nitrates.
Intercontinental transport of a tracer released in Asia.
Intercontinental transport of a tracer released in the eastern U.S..
CMAQ tracer transport calculations (shown above) illustrate how air pollutants near the Earth’s surface can be convectively lofted to higher altitudes where strong winds can efficiently transport them from one continent to another, thereby impacting air quality on intercontinental to global scales. Thus, strategies for reduction of pollution levels in surface air over a region are complicated not only by the interplay of local emissions sources and several complex physical, chemical, dynamical processes in the atmosphere, but also by hemispheric background levels of pollutants. Changing emission patterns across the globe are likely changing background pollution levels that must be accurately characterized both for NAAQS development and implementation.
To enable the consistent representation of these process interactions and robustly assess changes in regional air quality in context of the changing global atmosphere, the applicability of the CMAQ modeling system was extended to hemispheric scales through systematic investigation of key model processes and attributes influencing simulated distributions of O3, fine particulate matter (PM2.5), and precursor species. Improvements to model process representation (stratospheric O3 influences, representation of NOx recyling through organic nitrates, halogen chemistry in marine environments, deposition over water), structure (model vertical extent and layer resolution), and inputs (allocation of global emission estimates) were investigated and evaluated through comparison of model predictions with measurements from surface, aloft, remote sensing and specialized field campaign platforms (Sarwar et al., 2015; Mathur et al., 2017).
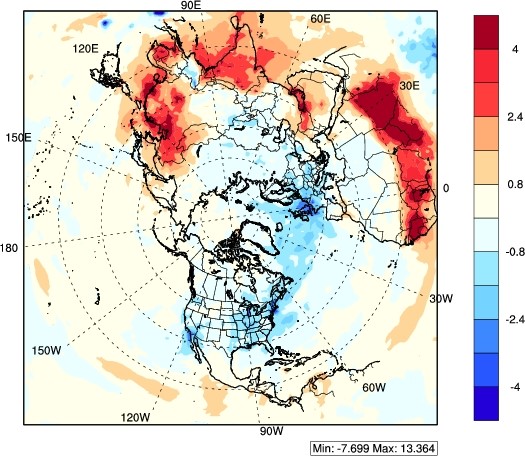
The ability of the coupled WRF-CMAQ model in reproducing the historical trend in O3 and its precursor species, PM2.5 and its constituent species, aerosol optical depth (AOD), and clear-sky short-wave radiation over the northern hemisphere has been evaluated through comparison of 21-year simulated results with observation-derived records during 1990-2010 (Xing et al., 2015a; Mathur et al., 2017) . Aerosol direct radiative effects (ADE) cool surface temperatures thereby partially offsetting the warming from greenhouse gases (Xing et al., 2015b). The induced cooling also impacts atmospheric ventilation, especially in polluted and populated regions, which in turn exacerbate air pollution and associated human exposure (Xing et al, 2015c). A combined assessment of these two manifestations of ADE for historical and documented changes in the state of our atmosphere, show that mitigating aerosol pollution is beneficial in decreasing the impacts of climate change. Air pollution changes due to ADE translate to additional health benefits in regions with control measures, but a penalty in regions witnessing air quality deterioration (Xing et al., 2016; Wang et al., 2017).
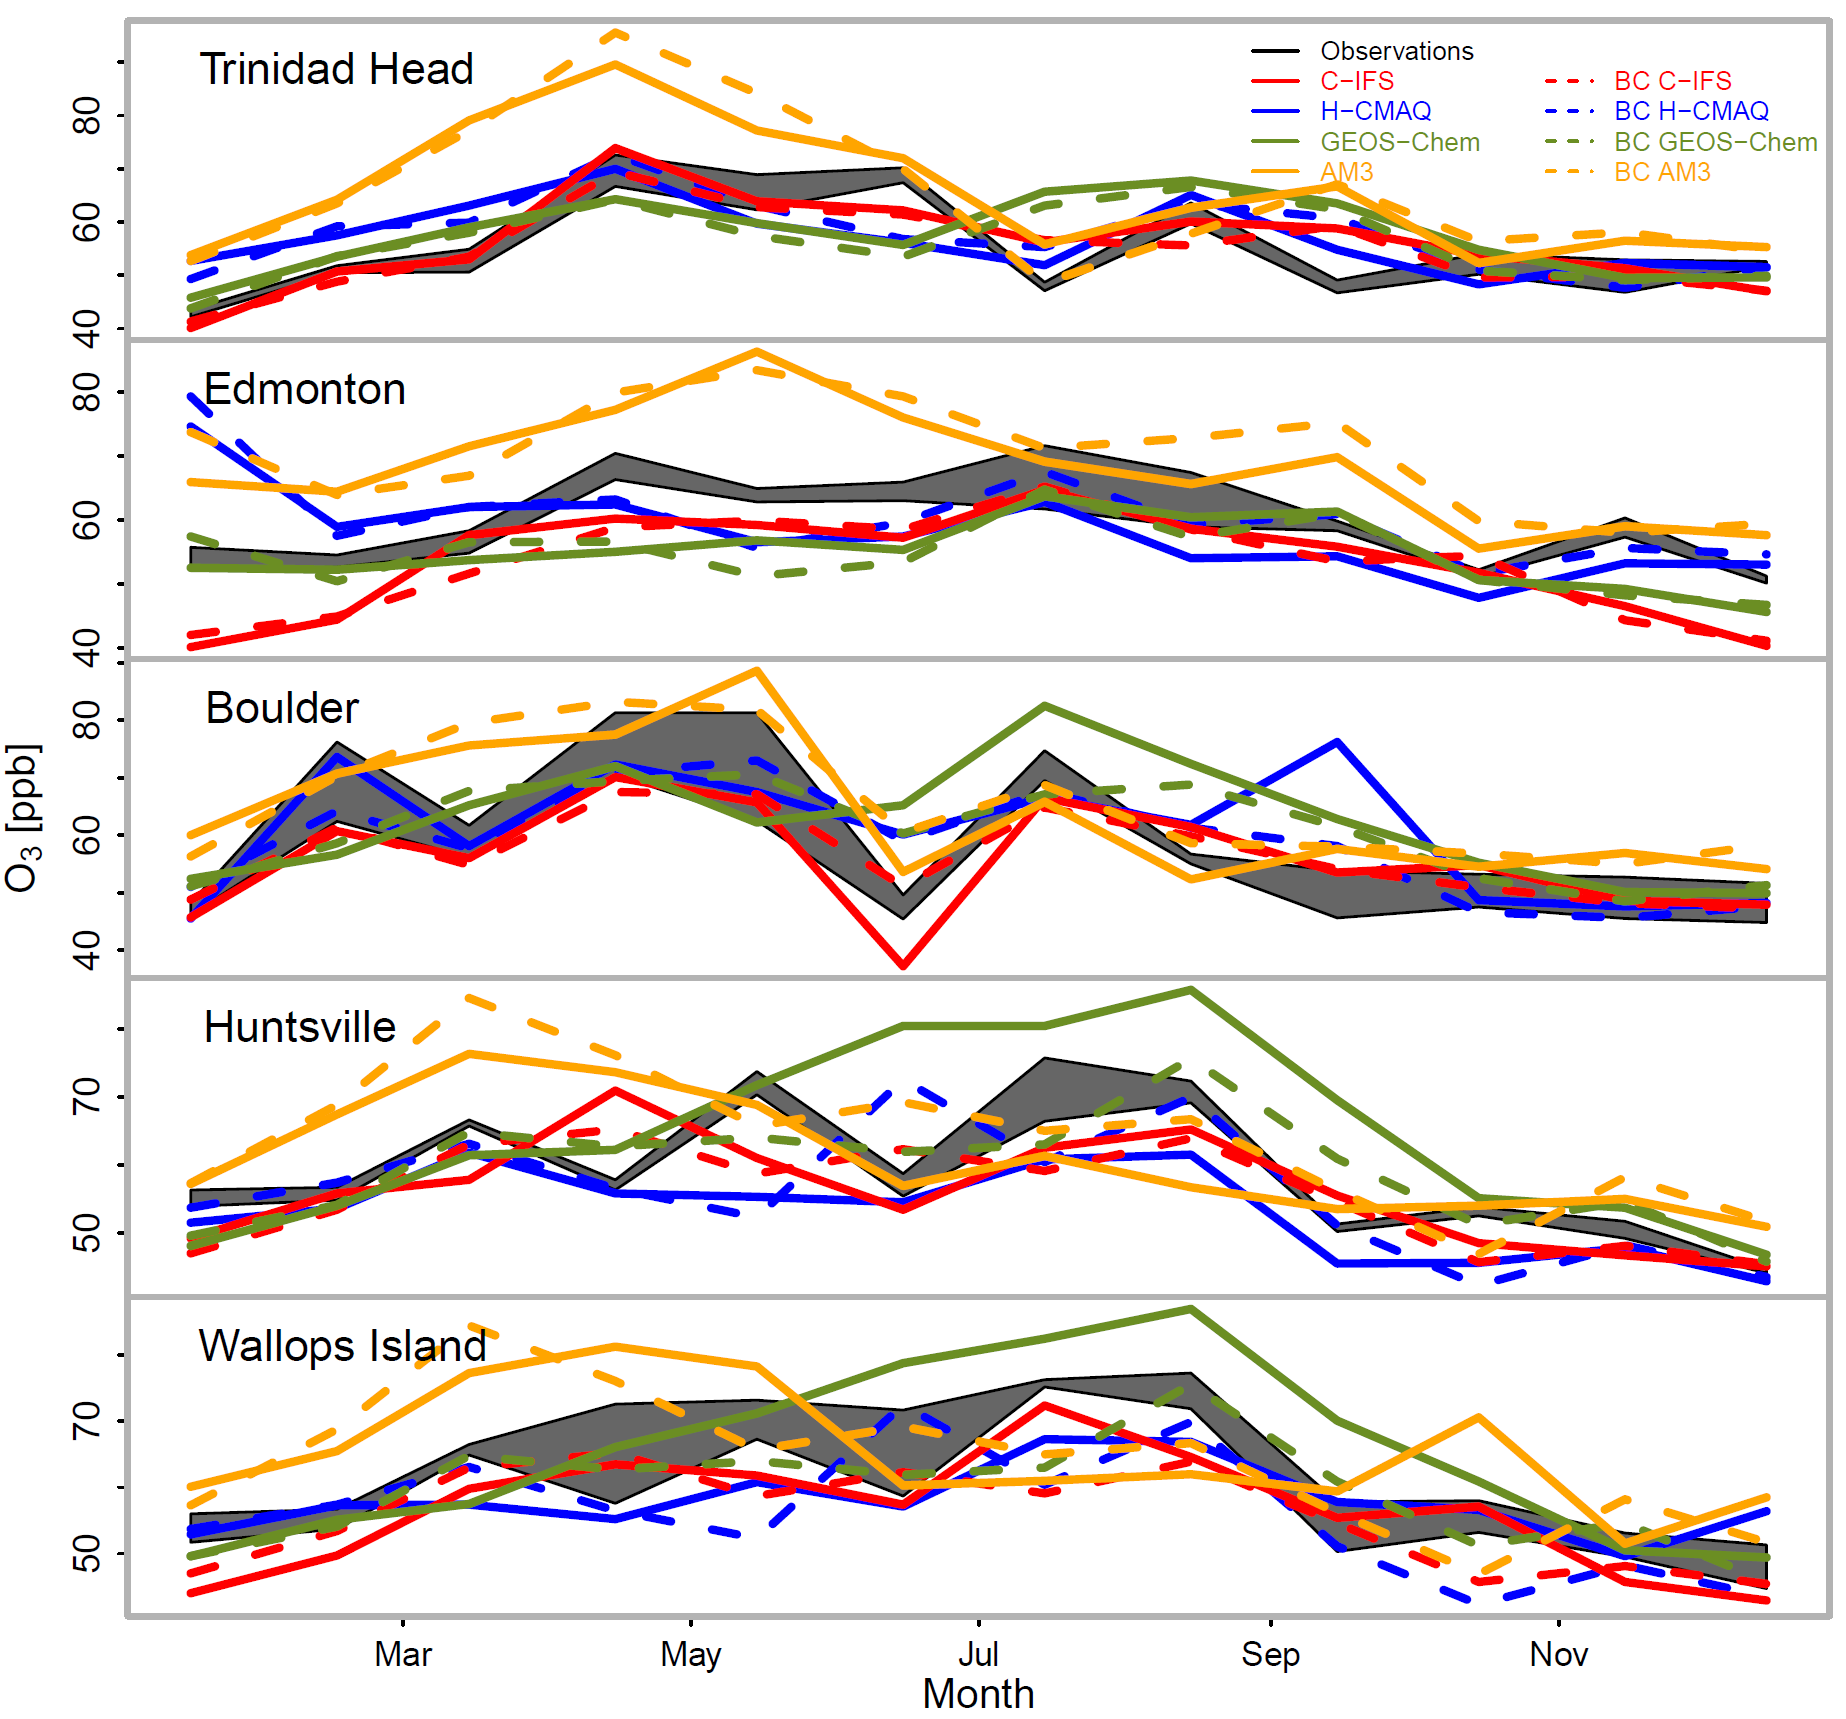
The successful expansion of coupled WRF-CMAQ model to the hemispheric scales now provides a robust framework to examine interactions between atmospheric processes occurring at various spatial and temporal scales in a consistent manner. Changes in emission patterns over different regions of the world are likely to exacerbate the impacts of long-range pollutant transport on background pollutant levels in the U.S., which may then impact the attainment of local air quality standards (Mathur et al., 2016). Applications of the modeling system can be conducted to examine air quality across the U.S. in context of the changing global atmosphere. The performance of the hemispheric CMAQ model is comparable with measurements and other contemporary large-scale atmospheric models (Hogrefe et al., 2018). The hemispheric version of WRF-CMAQ is being used to characterize background pollution to the U.S. (Mathur et al., 2018; Henderson et al., 2019) as well as study interactions between air pollution and climate change.
References
Henderson, B.H., P. Dolwick, C. Jang, A. Eyth, J. Vukovich, R. Mathur, C. Hogrefe, G. Pouliot, B. Timin, K. W. Appel (2019), Global Sources of North American Ozone, Presented at 2019 CMAS Conference, available at: https://cmascenter.org/conference//2019/slides/0830_henderson_global_sources_2019.pptx.
Hogrefe, C., Liu, P., Pouliot, G., Mathur, R., Roselle, S., Flemming, J., Lin, M., and Park, R. J.(2018), Impacts of different characterizations of large-scale background on simulated regional-scale ozone over the continental United States, Atmos. Chem. Phys., 18, 3839-3864, https://doi.org/10.5194/acp-18-3839-2018.
Mathur, R., Xing, J., Napelenok, S., Pleim, J., Hogrefe, C., Wong, D., Gan, C.-M., & Kang, D. (2016). Multiscale modeling of multi-decadal trends in ozone and precursor species across the northern hemisphere and the United States, Air Pollution Modeling and Its Application XXIV, D. Steyn and N. Chaumerliac (Eds.), 239-24. doi: 10.1007/978-3-319-24478-5_39.
Mathur, R., Xing, J., Gilliam, R., Sarwar, G., Hogrefe, C., Pleim, J., Pouliot, G., Roselle, S., Spero, T. L., Wong, D. C., and Young, J.(2017), Extending the Community Multiscale Air Quality (CMAQ) modeling system to hemispheric scales: overview of process considerations and initial applications, Atmos. Chem. Phys., 17, 12449-12474, https://doi.org/10.5194/acp-17-12449-2017.
Mathur, R., Daiwen, K., Napelenok, S.L., Xing, J., Hogrefe, C., Sarwar, G., Itahashi, S., Henderson, B.H. (2022) How Have Divergent Global Emission Trends Influenced Long-Range Transported Ozone to North America? Journal of Geophysical Research: Atmospheres, e2022JD036926. https://doi.org/10.1029/2022JD036926
Mathur, R., D. Kang, S. Napelenok, J. Xing, and C. Hogrefe, A Modeling Study of the Influence of Hemispheric Transport on Trends in O3 Distributions over North America (2018), In: Mensink C., Kallos G. (eds) Air Pollution Modeling and its Application XXV, pp 13-18, Springer Proceedings in Complexity. Springer, Cham. https://doi.org/10.1007/978-3-319-57645-9_2.
Sarwar, G., Gantt, B., Schwede, D., Foley, K., Mathur, R., & Saiz-Lopez, A. (2015). Impact of enhanced ozone deposition and halogen chemistry on tropospheric ozone over the northern hemisphere. Environ. Sci. Technol., 49(15), 9203–9211. doi: 10.1021/acs.est.5b01657.
Wang, J., J. Xing, R. Mathur, J. Pleim, S. Wang, C. Hogrefe, C.-M. Gan, D. Wong, and J. Hao (2017), Historical trends in PM2.5 related premature mortality during 1990-2010 across the northern hemisphere, Environ. Health Perspect., DOI: 10.1289/EHP298.
Xing, J., R. Mathur, J. Pleim, C. Hogrefe, C. Gan, David-C Wong, C. Wei, R. Gilliam, and G. Pouliot (2015a), Observations and modeling of air quality trends over 1990-2010 across the northern hemisphere: China, the United States and Europe, Atmos. Chem & Phys., 15(5):2227-2914, doi:10.5194/acp-15-2723-2015. https://atmos-chem-phys.org/15/2723/2015/acp-15-2723-2015.pdf.
Xing, J., R. Mathur, J. Pleim, C. Hogrefe, C.-M. Gan, D. Wong, and C. Wei (2015b) Can a coupled meteorology-chemistry model reproduce the historical trend in aerosol direct radiative effects over the northern hemisphere?, Atmos. Chem & Phys., 15, 9997-10018, doi:10.5194/acp-15-9997-2015, 2015. https://www.atmos-chem-phys.net/15/9997/2015/acp-15-9997-2015.pdf.
Xing, J., R. Mathur, J. Pleim, C. Hogrefe, C.-M. Gan, D. Wong, C. Wei, and J. Wang (2015c) Air pollution and climate response to aerosol direct radiative effects: A modeling study of decadal rends across the northern hemisphere, J. Geophys. Res. Atmos., 120, 12221-12236, doi:10.1002/2015JD023933. https://onlinelibrary.wiley.com/doi/10.1002/2015JD023933/epdf.
Xing, J., J. Wang, R. Mathur, Jon Pleim, S. Wang, C. Hogrefe, C. Gan, David-C Wong, and J. Hao (2016), Unexpected benefits of reducing aerosol cooling effects, Environ. Sci. Technol., 50 (14), 7527-7534, DOI: 10.1021/acs.est.6b00767.