Incremental Evaluation of CMAQv5.2
Over the last two decades, new versions of the CMAQ model have been periodically released. Each new version consists of multiple updates to the model’s scientific algorithms and input data quality. Since CMAQ is used by the USEPA, as well as State and Regional offices, to estimate criteria pollutant (e.g. ozone, OO3Ozone (O3) is a colorless gas with a pungent odor. It is found in two layers of the atmosphere, the stratosphere and the troposphere. In the stratosphere, ozone provides a protective layer shielding the Earth from ultraviolet radiation's potentially harmful health effects. At ground level (the troposphere), ozone is a pollutant that affects human health and the environment, and contributes to the formation of smog.; fine particulate matter, PM2.5) concentrations, each new release requires a comprehensive evaluation to establish model credibility for a wide range of applications. The CMAQ modeling system version 5.2 (v5.2) was tested and evaluated against observations and was publicly released in June 2017.
Major Updates to the CMAQv5.2 Modeling System
-
Transition from WRFv3.7 to WRFv3.8
- PAR function and impact on transpiration modified by Jon Pleim
- Numerous other updates in WRFv3.8
- WRFv3.8 with lightning assimilation
- Assimilation of lightning strike data from the National Lightning Detection Network (NLDN)
- Force deep convection where lightning is observed; only allow shallow convection where it is not
- Science updates in CMAQv5.2
- Increased O3 deposition to wetted surfaces (particularly important in the early morning hours)
- Updated organic aerosol (OA) with semivolatile primary OA and empirical secondary OA formation from combustion sources
- Large decreases in primary OA in both summer (75-95%) and winter (55-90%)
- In summer, increase in OA due to the increased contribution from secondary OA formation pathways
- Updated windblown dust scheme
- Updated sub-grid cloud scheme
- Revised the O3 dry deposition (M3Dry update) to correct an error in an update that was implemented in CMAQv5.1
- Update from the 2011 NEI v2 eh to 2011 NEI v2 ek platform
- Updated from MOVES2014 to MOVES2014a for mobile emissions (updates for TX, OH, NJ, CA, AZ)
- Revised spatial surrogates for underway emissions from commercial marine
- Update from the CB05e51 to CB6r3 chemical mechanism
- Generally lower O3 and NO2 from lower production of alkyl nitrates (winter), lack of NOx recycling, lower HO2 and higher heterogeneous removal of nitrates
- Transition from GEOS-Chem to hemispheric CMAQ for lateral boundary conditions
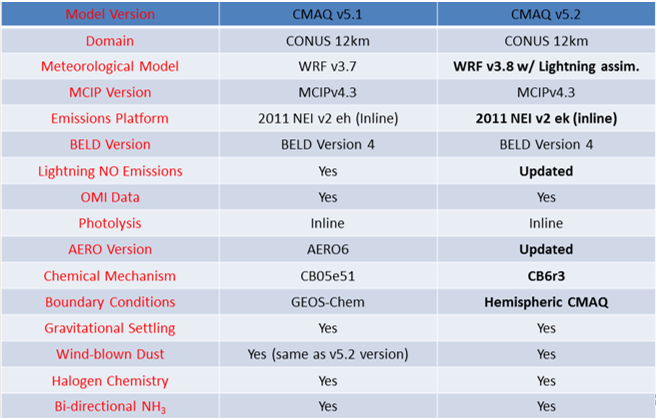
CMAQ Simulation Details
Figure 1 shows the CMAQ simulation configuration for the CMAQv5.1 base simulation and the CMAQv5.2 final simulation. Both simulations cover the contiguous U.S. (CONUS), using the same version of MCIP, OMI data, and in-line photolysis scheme. Indicated in bold are those aspects of the modeling system that differ in the CMAQv5.2 simulation. These include updates to the WRF meteorology, emissions, lightning NO emissions, AERO version, chemical mechanism version and boundary conditions (BCs).
Ozone
Figure 2 shows the change in ground-level O3 for July 2011 from the various updates in the CMAQv5.2 modeling system. The top left plot in the figure shows the CMAQv5.1 modeled O3 mixing ratio, while the top right plot in the figure shows the change in O3 between CMAQv5.1 and CMAQv5.2. The remaining plots in the figure show the change in O3 from the individual updates to the modeling system. These updates are:
- Transition to WRFv3.8 (WRFv3.8)
- Lightning assimilation in WRFv3.8 (Lightning Assimilation)
- Science updates in CMAQv5.2 (Updates in CMAQv5.2)
- Update from NEIv2 eh to NEIv2 ek platform (Emissions Update)
- Transition to the CB6 chemical mechanism (CB6r3 Chemical Mechanism)
- Update to the lightning NO calculation (Lightning NO Calculation Update)
- Transition from GEOS-Chem to Hemispheric CMAQ for Boundary Conditions
- Update to the O3 dry deposition (M3Dry update)
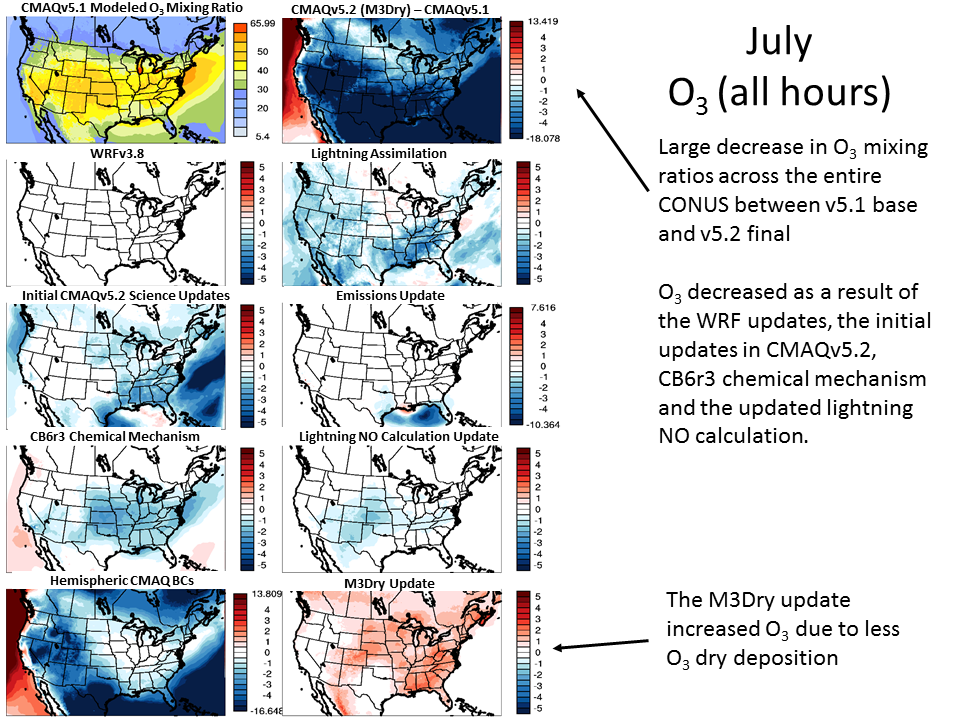
Overall, there is a large decrease in O3 in CMAQv5.2 compared to CMAQv5.1, with monthly average decreases exceeding 5 ppb in a large portion of the eastern U.S. All the updates shown contribute to the decrease in O3 at least in some part, with the largest decreases in O3 coming from the science updates in CMAQv5.2 and the transition to the CB6r3 chemical mechanism. The transition to WRF3.8 and the lightning assimilation in WRF also lower O3 mixing ratios in many areas in July. The emissions update had the largest effect on O3 over the Gulf of America, while updates to the lightning NO calculation had the largest impact in the western U.S. The transition from GEOS-Chem to Hemispheric CMAQ as lateral boundary conditions results in a large reduction in O3 in July, whereas the update to the O3 dry deposition results in a widespread increase in O3 in July.
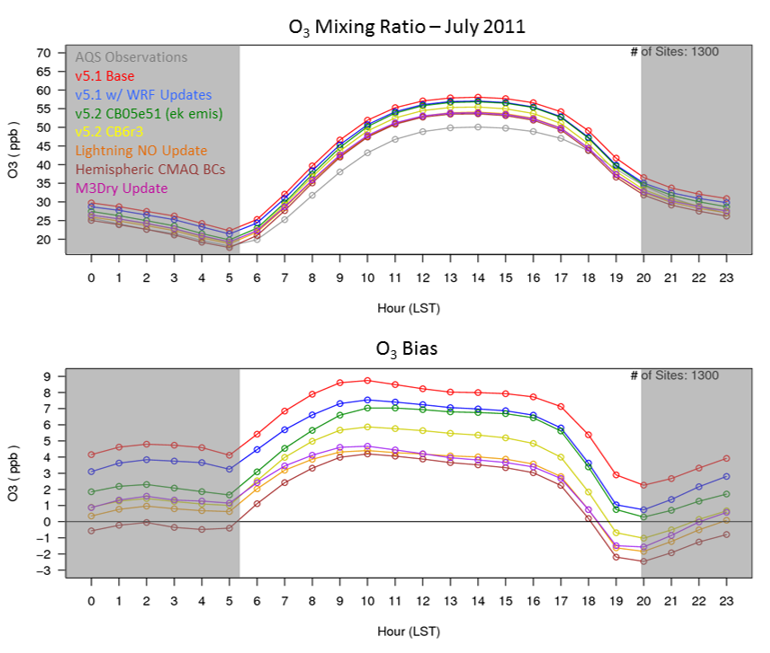
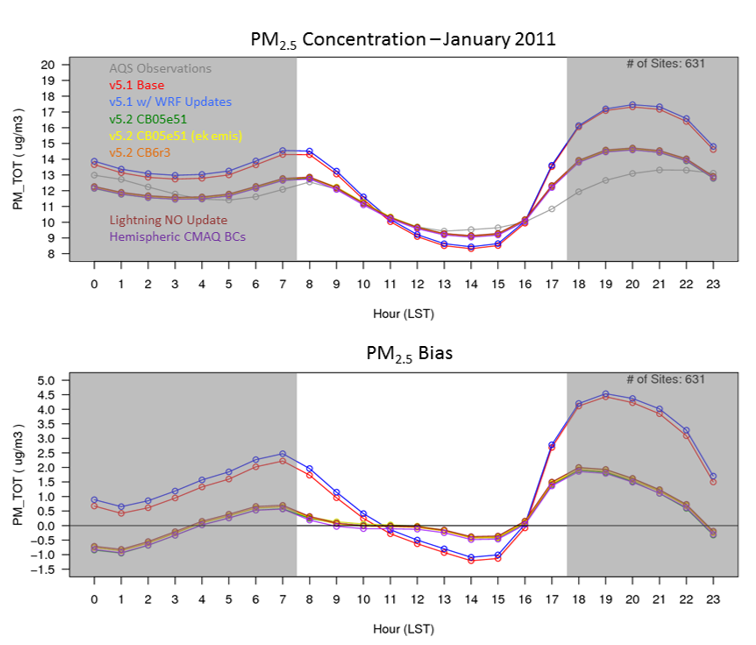
Figure 3 shows the monthly average observed and model simulation diurnal O3 mixing ratio for the simulations show in Figure 2. The observed/simulated O3 mixing ratio is shown on the top Figure 4, while the model bias is shown on the bottom. The CMAQv5.1 simulation (red) has the largest bias, with O3 overestimated throughout the entire day. The transition to WRFv3.8 and the lightning assimilation (shown in blue as a single update) decrease O3 throughout the entire day. The emissions update (green) primarily decreases O3 during the overnight hours, while the transition to the CB6r3 chemical mechanism (yellow) has the greatest decrease on O3 during the middle of the day. The lightning NO update (orange) has a small impact on O3, while the transition from GEOS-Chem to Hemispheric CMAQ as boundary conditions results in a large decrease in O3.
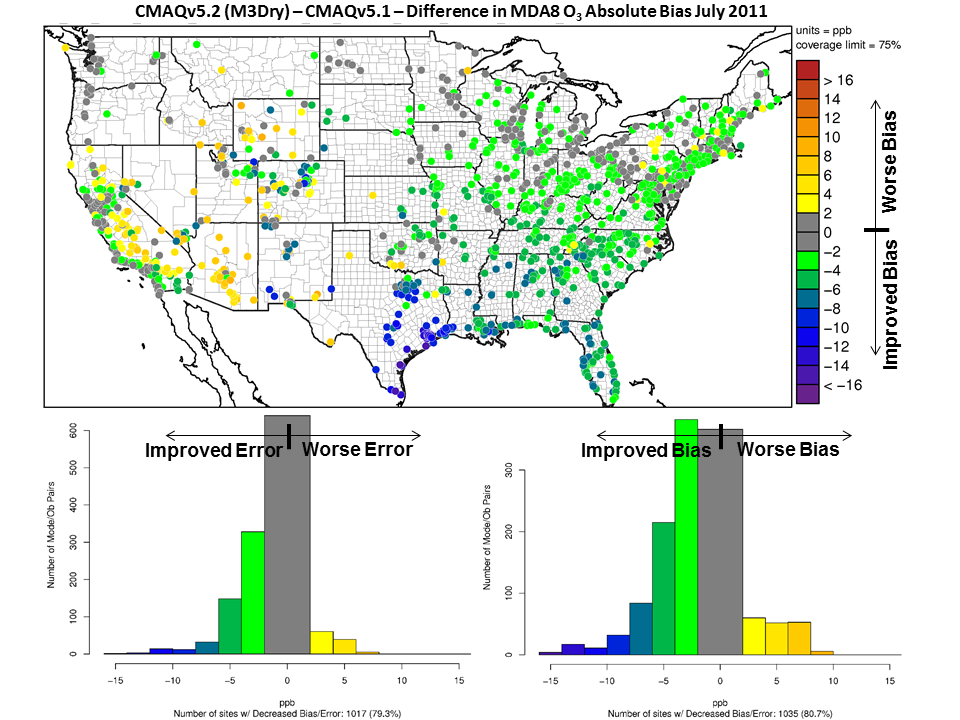
Figure 4 shows the change in daily maximum 8-hr average O3 (MDA8) bias between CMAQv5.1 and CMAQv5.2. Warm colors indicate higher bias in the CMAQv5.2 simulation, while cool colors indicate lower bias in the CMAQv5.2 simulation. With the exception of the San Joaquin Valley (SJV) in California, MDA8 O3 bias decreases with CMAQv5.2 for most sites. The largest decreases occur along the Gulf Coast in Louisiana and Texas. Overall, about 80% of the sites show a decrease in MDA8 O3 bias between the CMAQv5.1 and CMAQv5.2 simulations.
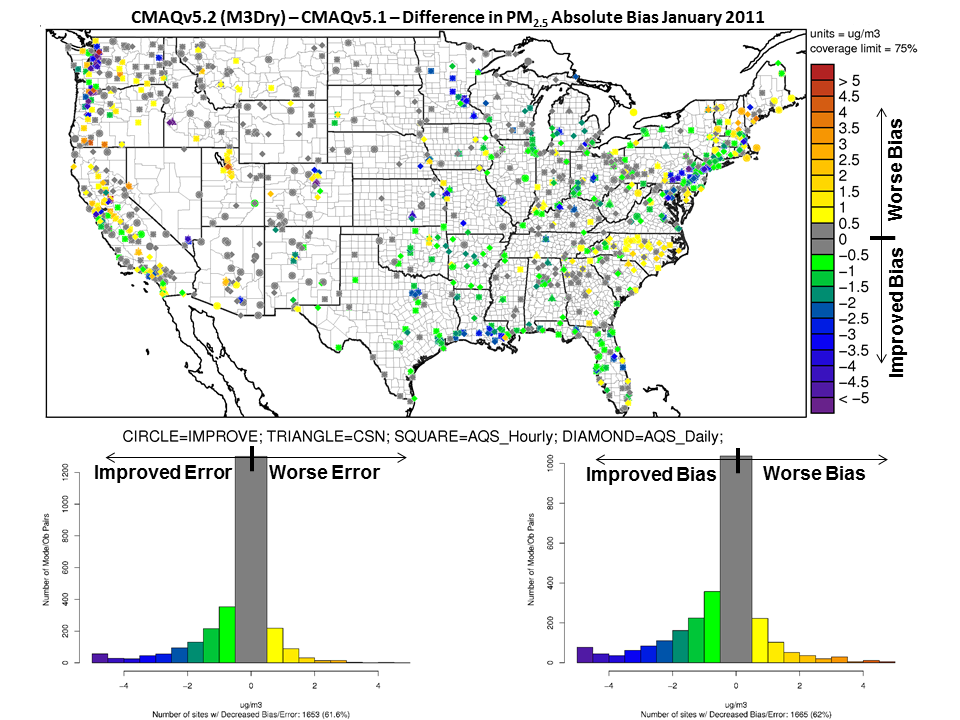
PM2.5
Figure 5 shows the change in monthly average PM2.5 between CMAQv5.1 and CMAQv5.2 for January 2011, along with the change in PM2.5 due to the various updates to the CMAQv5.2 modeling system. The upper left plot in the figure shows the CMAQv5.1 simulated PM2.5 concentration, while the upper left plot shows the change in monthly average PM2.5 between CMAQv5.1 and v5.2. The remaining plots in the figure show the change in PM2.5 from the individual updates to the modeling system as listed above.
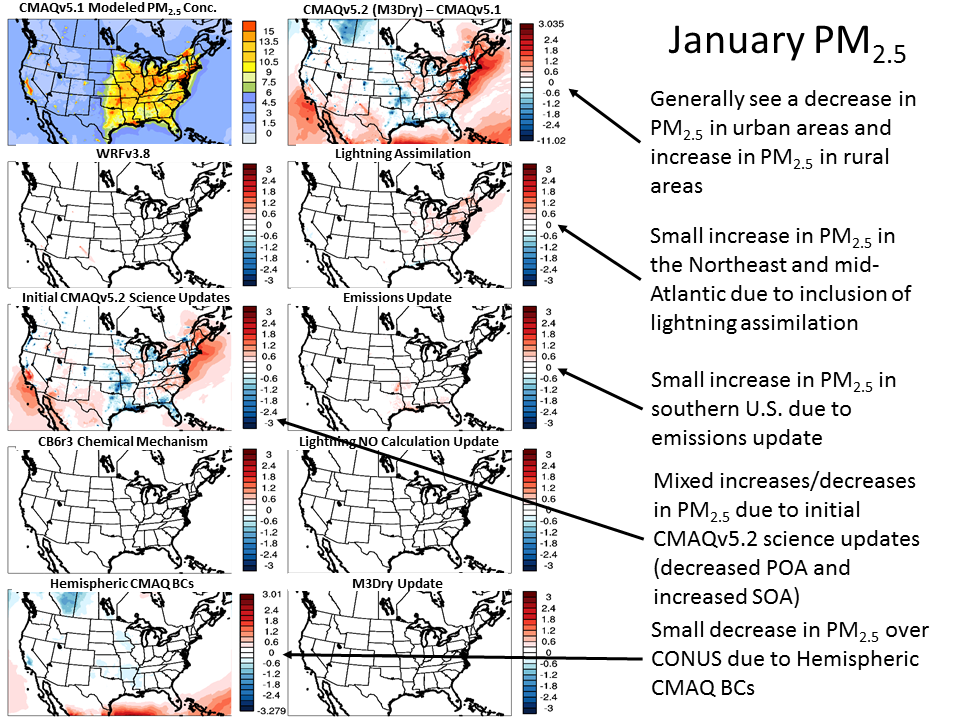
There is a mixed single between increases and decreases in PM2.5 in January, with the science updates in CMAQv5.2 primarily responsible for the changes in PM2.5 concentration. Lightning assimilation resulted in a small increase in PM2.5, as did the emissions update. The transition to hemispheric CMAQ for BCs had a small impact in CONUS, but did impact areas in Canada and the Gulf of America near the simulation boundaries.