
Sources of Greenhouse Gas Emissions
On this page:
Sources of Greenhouse Gas Emissions: Overview
Greenhouse gases trap heat and make the planet warmer. Human activities are responsible for almost all of the increase in greenhouse gases in the atmosphere over the last 150 years.1 The largest source of greenhouse gas emissions from human activities in the United States is from burning fossil fuels for electricity, heat, and transportation.
EPA tracks total U.S. emissions by publishing the Inventory of U.S. Greenhouse Gas Emissions and Sinks. This annual report estimates the total national greenhouse gas emissions and removals associated with human activities across the United States by source, gas, and economic sector.
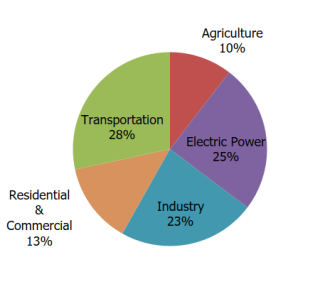
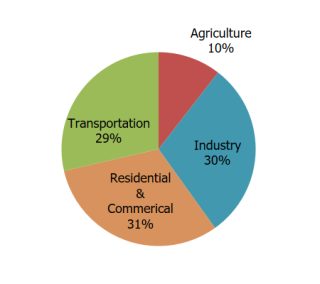
Total emissions in 2022 are 6,343.2 Million Metric Tons of CO₂ equivalent. Percentages may not add up to 100% due to independent rounding. Greenhouse gas emissions from the commercial, residential, and industrial sectors increase substantially when indirect emissions from electricity end-use are included, due to the relatively large share of electricity use by buildings (e.g., heating, ventilation, and air conditioning; lighting; appliances and plug load) and use of electricity for powering industrial machinery. More information is also in the electricity end-use emissions section of the Electric Power sector page.
Land Use, Land-Use Change, and Forestry in the United States is a net sink and offsets 13% of these greenhouse gas emissions. This net sink is not shown in the above diagrams. All emission estimates are sourced from the Inventory of U.S. Greenhouse Gas Emissions and Sinks: 1990–2022.
What are the primary sources of U.S. greenhouse gas emissions and sinks in each economic sector?
- Transportation – Greenhouse gas emissions from transportation primarily come from burning fossil fuel for cars, trucks, ships, trains, and planes. Over 94% of the fuel used for transportation is petroleum based, which includes primarily gasoline and diesel and results in direct emissions.2 The transportation sector is the largest source of direct greenhouse gas emissions and second largest source when indirect emissions from electricity end-use are allocated across sectors. The transportation sector is an end-use sector for electricity but currently represents a relatively low percentage of total electricity use. Indirect emissions from electricity are less than 1 percent of direct emissions.
- Electricity production – Electric power includes emissions from electricity production used by other end use sectors (e.g., industry). In 2022, 60% of our electricity comes from burning fossil fuels, mostly coal and natural gas.3
- Industry – Greenhouse gas emissions from industry primarily come from burning fossil fuels for energy, as well as greenhouse gas emissions from certain chemical reactions necessary to produce goods from raw materials. Industrial emissions are the third largest source of direct emissions. If indirect emissions from electricity use are allocated to the industrial end-use sector (e.g. to power industrial buildings and equipment), industrial activities account for a much larger share of U.S. greenhouse gas emissions as shown above.
- Commercial and Residential – Greenhouse gas emissions from the commercial and residential sector come from fossil fuels burned for heat and the use of gases for refrigeration and cooling in buildings, and non-building specific emissions such as the handling of waste. The commercial and residential sector emissions increase substantially when indirect emissions from electricity end-use are included, largely because buildings use 75% of the electricity generated in the US (e.g., for heating, ventilation and air conditioning; lighting; appliances, and plug loads).4 When emissions from electricity use are distributed to the commercial and residential end-use sector, commercial and residential activities account for a much larger share of U.S. greenhouse gas emissions as shown above.
- Agriculture – Greenhouse gas emissions from agriculture come from livestock such as cows, agricultural soils, and rice production. Indirect emissions from electricity use in agricultural activities (e.g., powering buildings and equipment) are about 5 percent of direct emissions.
- Land Use and Forestry – While not shown in the figure, land areas can act as a sink (absorbing CO2 from the atmosphere) or a source of greenhouse gas emissions. In the United States, since 1990, managed forests and other lands are a net sink, i.e., they have absorbed more CO2 from the atmosphere than they emit, offsetting 13% of total gross greenhouse gas emissions.
See Emissions Information and Reduction Strategies by Source
Electric Power Transportation Industry Commercial/Residential
Greenhouse Gas Emissions Trends: All Sources
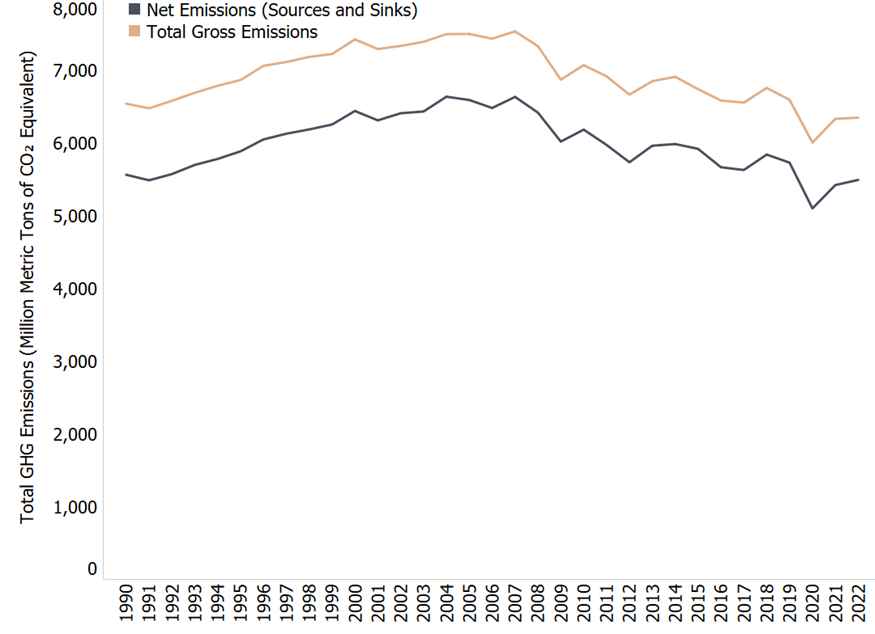
- Since 1990, gross U.S. greenhouse gas emissions have decreased by just over 3%. From year to year, emissions can rise and fall due to changes in the economy, the price of fuel, and other factors.
- In 2022, U.S. greenhouse gas emissions increased 0.2% compared to 2021 levels. In 2020, there was a sharp decline in emissions largely due to the impacts of the coronavirus (COVID-19) pandemic on travel and other economic activity. In 2021 and 2022, the increase in total greenhouse gas emissions was driven largely by an increase in CO2 emissions from fossil fuel combustion due to the continued rebound in economic activity after the height of the COVID-19 pandemic.
- In 2022, CO2 emissions from fossil fuel combustion increased by 8% relative to 2020 and 1% relative to 2021. CO2 emissions from natural gas consumption increased by 5% relative to 2021. CO2 emissions from coal consumption decreased by 6% from 2021. The increase in natural gas consumption and emissions in 2022 is observed across all sectors except for U.S. Territories, while the coal decrease in primarily in the electric power sector. Emissions from petroleum use increased by less than 1% in 2022.
References
- IPCC (2013) Climate Change 2013: The Physical Science Basis. Contribution of Working Group I to the Fifth Assessment Report of the Intergovernmental Panel on Climate Change. [Stocker, T.F., D. Qin, G.K. Plattner, M. Tignor, S.K. Allen, J. Boschung, A. Nauels, Y. Xia, V. Bex and P.M. Midgley (eds.)]. Cambridge University Press, Cambridge, United Kingdom and New York, NY, USA, 1535 pp. .
- IPCC (2022): Climate Change 2022: Mitigation of Climate Change. Contribution of Working Group III to the Sixth Assessment Report of the Intergovernmental Panel on Climate Change [P.R. Shukla, J. Skea, R. Slade, A. Al Khourdajie, R. van Diemen, D. McCollum, M. Pathak, S. Some, P. Vyas, R. Fradera, M. Belkacemi, A. Hasija, G. Lisboa, S. Luz, J. Malley, (eds.)]. Cambridge University Press, Cambridge, UK and New York, NY, USA. doi: 10.1017/9781009157926
- U.S. Energy Information Administration (2023). Electricity Explained – Basics
- National Renewable Energy Laboratory (2023). NREL Researchers Reveal How Buildings Across United States Do—and Could—Use Energy. Shoemaker, Susannah.