U.S. flag

An official website of the United States government

Here’s how you know

Dot gov

Official websites use .gov
A .gov website belongs to an official government organization in the United States.

HTTPS

Secure .gov websites use HTTPS
A lock (LockA locked padlock) or https:// means you’ve safely connected to the .gov website. Share sensitive information only on official, secure websites.

    • Environmental Topics
    • Air
    • Bed Bugs
    • Cancer
    • Chemicals, Toxics, and Pesticide
    • Emergency Response
    • Environmental Information by Location
    • Health
    • Land, Waste, and Cleanup
    • Lead
    • Mold
    • Radon
    • Research
    • Science Topics
    • Water Topics
    • A-Z Topic Index
    • Laws & Regulations
    • By Business Sector
    • By Topic
    • Compliance
    • Enforcement
    • Laws and Executive Orders
    • Regulations
    • Report a Violation
    • Environmental Violations
    • Fraud, Waste or Abuse
    • About EPA
    • Our Mission and What We Do
    • Headquarters Offices
    • Regional Offices
    • Labs and Research Centers
    • Planning, Budget, and Results
    • Organization Chart
    • EPA History

Breadcrumb

  1. Home
  2. Causal Analysis/Diagnosis Decision Information System (CADDIS)

Quantile Regression: EPT Relative Abundance vs. Percent Sands and Fines for Minnesota Streams
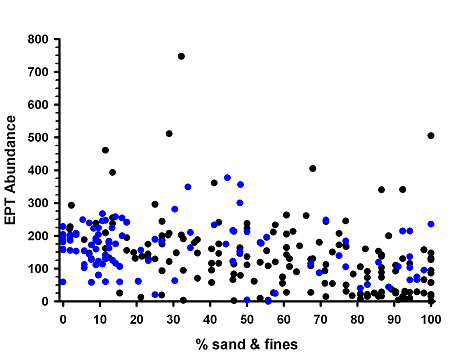
EPT Abundance
 
Helpful Links

On this Page

  • Plot
  • Model
  • Data Analysis
  • Data Origin
  • Sampling Design
  • Contact

Back to: Field Stressor-Response Association Gallery

Plot

  1. Analysis: Quantile regression
  2. Independent variable: Percentage (%), sand and fines
  3. Dependent variable: EPT (Ephemeroptera, Plecoptera and Trichoptera) abundance/m²
  4. Classification variables: Ecoregion class - dummy variable = 0 if the Ecoregions are 46, 47, or 51 and dummy variable = 1 if the Ecoregions are 50 or 52
  5. Key: symbols = observations, solid line = mean line, dashed line = 95% prediction limit, black lines and symbols = Ecoregions 46, 47 and 51, blue lines and symbols = Ecoregions 50 and 52
  6. Sample size: n = 267

Model

  1. Model not plotted due to conflicting resultsa.
  2. Date: 6 October, 2006
Variable Estimate Chi2 p
Intercept 341.6      
Ecoregion class -93.0 2.74 0.098
% Sand & fines -1.88 6.08 0.014a
% Sand & fines x Ecoregion class 1.75 2.66  0.10

aHowever, Chi2 had a p > 0.05 (Chi2 = 1.09, p = 0.30) when "ecoregion class" was removed from the quantile regression.

Data Analysis

  1. Model generated using SAS Proc QUANTREG with the smoothing algorithm. The Wald test statistic was used to test the linear null hypothesis, H0: slope=0, for all independent variables (i.e., ecoregion class, % sand & fines, and ecoregion class x % sand & fines.)
  2. The ecoregions were aggregated into two classes because a preliminary ANOVA indicated that the base material for bedded sediments, % coarse substrates, was significantly greater in Ecoregions 50 and 52 than in Ecoregions 46, 47, and 51. Percent coarse substrates, however, did not significantly differ within either group.
  3. Replicate visits to a site were excluded from the data set.

Data Origin

  1. Agency: Minnesota Pollution Control Agency, St. Paul, Minnesota 
  2. Location: Minnesota - analyses restricted to wadeable sites (52 km² < watershed area < 523 km²) from the five ecoregions indicated below.
  3. Omernik Level III Ecoregions examined include: 46 (Northern Glaciated Plains), 47 (Western Corn Belt Plains), 50 (Northern Lakes and Forests), 51 (North Central Hardwoods), and 52 (Driftless Area).

Sampling Design

  1. Data collected 1996 through 2004.

Contact

Michael B. Griffith, griffith.michael@epa.gov, (513) 569-7034

Causal Analysis/Diagnosis Decision Information System (CADDIS)

  • CADDIS Home
    • About CADDIS
    • Frequent Questions
    • Publications
    • Recent Additions
    • Related Links
    • CADDIS Glossary
  • Volume 1: Stressor Identification
    • About Causal Assessment
    • Getting Started
    • Step 1. Define the Case
    • Step 2. List Candidate Causes
    • Step 3. Evaluate Data from the Case
    • Step 4. Evaluate Data from Elsewhere
    • Step 5. Identify Probable Causes
  • Volume 2: Sources, Stressors and Responses
    • About Sources
      • Urbanization
    • About Stressors
  • Volume 3: Examples and Applications
    • Analytical Examples
    • Worksheet Examples
    • State Examples
    • Case Studies
    • Galleries
  • Volume 4: Data Analysis
    • Selecting an Analysis Approach
    • Getting Started
    • Basic Principles & Issues
    • Exploratory Data Analysis
    • Basic Analyses
    • Advanced Analyses
    • PECBO Appendix
    • Download Software
    • Data Analysis Topics (A -Z)
  • Volume 5: Causal Databases
    • Learn about CADLink
Contact Us about CADDIS
Contact Us to ask a question, provide feedback, or report a problem.
Last updated on February 7, 2025
  • Assistance
  • Spanish
  • Arabic
  • Chinese (simplified)
  • Chinese (traditional)
  • French
  • Haitian Creole
  • Korean
  • Portuguese
  • Russian
  • Tagalog
  • Vietnamese
United States Environmental Protection Agency

Discover.

  • Accessibility Statement
  • Budget & Performance
  • Contracting
  • EPA www Web Snapshot
  • Grants
  • No FEAR Act Data
  • Plain Writing
  • Privacy
  • Privacy and Security Notice

Connect.

  • Data
  • Inspector General
  • Jobs
  • Newsroom
  • Regulations.gov
  • Subscribe
  • USA.gov
  • White House

Ask.

  • Contact EPA
  • EPA Disclaimers
  • Hotlines
  • FOIA Requests
  • Frequent Questions
  • Site Feedback

Follow.