U.S. flag

An official website of the United States government

Here’s how you know

Dot gov

Official websites use .gov
A .gov website belongs to an official government organization in the United States.

HTTPS

Secure .gov websites use HTTPS
A lock (LockA locked padlock) or https:// means you’ve safely connected to the .gov website. Share sensitive information only on official, secure websites.

    • Environmental Topics
    • Air
    • Bed Bugs
    • Cancer
    • Chemicals, Toxics, and Pesticide
    • Emergency Response
    • Environmental Information by Location
    • Health
    • Land, Waste, and Cleanup
    • Lead
    • Mold
    • Radon
    • Research
    • Science Topics
    • Water Topics
    • A-Z Topic Index
    • Laws & Regulations
    • By Business Sector
    • By Topic
    • Compliance
    • Enforcement
    • Laws and Executive Orders
    • Regulations
    • Report a Violation
    • Environmental Violations
    • Fraud, Waste or Abuse
    • About EPA
    • Our Mission and What We Do
    • Headquarters Offices
    • Regional Offices
    • Labs and Research Centers
    • Planning, Budget, and Results
    • Organization Chart
    • EPA History

Breadcrumb

  1. Home
  2. San Francisco Bay Delta
  3. Protect
  4. Technical Support

Fish and Salinity in the San Francisco Estuary

Return to: Technical Support and Regulatory Assistance

EPA created maps for six fish species that show changes in abundance and distribution as they relate to seasonal changes in the salinity gradient over a 33-year time period. The maps visualize established salinity-abundance relationships and show how distribution has changed over time in the San Francisco Bay Delta Estuary.

Page from San Francisco Estuary Delta Smelt Catch and Seasonal Salinity Gradient showing data for 1980 - Bay Area watershed map with salinity gradients marked.

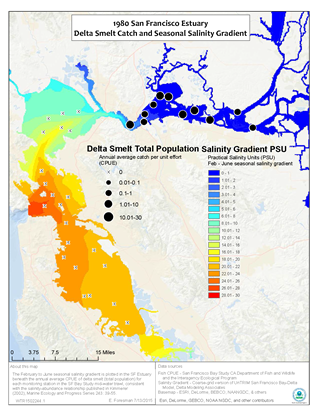
The seasonal salinity gradient was simulated by the coarse-grid version of the UnTRIM San Francisco Bay-Delta Model and fish monitoring data are from the San Francisco Bay Study.

The maps show that the abundance of a number of fish species is higher when the low salinity zone is within or westward of Suisun Bay consistent with established science.

This work was published in the journal San Francisco Estuary and Watershed Science (July 2016), “3-D Simulations of the San Francisco Estuary with Subgrid Bathymetry to Explore Long-Term Trends in Salinity Distribution and Fish Abundance.”

Free viewers and readers are available to access documents on our website. If you encounter issues with assistive technology, please contact us.

  • San Francisco Estuary Delta Smelt Catch and Seasonal Salinity Gradient (pdf) (5.19 MB, July 2015)
    Seasonal salinity gradient and Delta smelt abundance and distribution from 1980-2012 in the San Francisco Estuary.
  • San Francisco Estuary Juvenile Longfin Smelt Catch and Seasonal Salinity Gradient (pdf) (4.95 MB, July 2015)
    Seasonal salinity gradient and juvenile Longfin smelt abundance and distribution from 1980-2012 in the San Francisco Estuary.
  • San Francisco Estuary Longfin Smelt Catch and Seasonal Salinity Gradient (pdf) (4.6 MB, July 2015)
    Seasonal salinity gradient and longfin smelt abundance and distribution from 1980-2012 in the San Francisco Estuary.
  • San Francisco Estuary Pacific Herring Catch and Seasonal Salinity Gradient (pdf) (5.05 MB, July 2015)
    Seasonal salinity gradient and Pacific herring abundance and distribution from 1980-2012 in the San Francisco Estuary.
  • San Francisco Estuary Sacramento Splittail Catch and Seasonal Salinity Gradient (pdf) (5.03 MB, July 2015)
    Seasonal salinity gradient and Sacramento splittail abundance and distribution from 1980-2012 in the San Francisco Estuary.
  • San Francisco Estuary Starry Flounder Catch and Seasonal Salinity Gradient (pdf) (5.12 MB, July 2015)
    Seasonal salinity gradient and starry flounder abundance and distribution from 1980-2012 in the San Francisco Estuary.
  • San Francisco Estuary Striped Bass Catch and Seasonal Salinity Gradient (pdf) (5.14 MB, July 2015)
    Seasonal salinity gradient and striped bass abundance and distribution from 1980-2012 in the San Francisco Estuary.

San Francisco Bay Delta

  • Learn
    • About the Watershed
    • Challenges
    • EPA's Role
    • EPA's Partners
    • Fish Consumption
    • Teacher's Page
    • What You Can Do
  • Protect
    • EPA's Activities
    • Action Plan
      • Advance Regional Monitoring
      • Accelerate Water Quality Improvement
      • Strengthen Estuarine Water Quality Standards
      • Download the Action Plan
      • ANPR Documents
      • ANPR Public Comments
    • Bay Delta Water Quality Control Plan Comments
    • Technical Support
      • 2012 EPA Low Salinity Zone Workshop
      • 2016 Chinook Salmon Thermal Tolerance Investigation
      • 2020 Chinook Salmon Thermal Tolerance Investigation
      • Fish and Salinity
      • Salinity and Flow Monitoring
    • Watershed EIS Comments
  • Restore
    • Community Successes
    • Feather and Sacramento Rivers
    • TMDL Progress Assessment
    • Tribal Water Projects
Contact the SF Bay Delta Team
Contact Us to ask a question, provide feedback, or report a problem.
Last updated on May 1, 2025
  • Assistance
  • Spanish
  • Arabic
  • Chinese (simplified)
  • Chinese (traditional)
  • French
  • Haitian Creole
  • Korean
  • Portuguese
  • Russian
  • Tagalog
  • Vietnamese
United States Environmental Protection Agency

Discover.

  • Accessibility Statement
  • Budget & Performance
  • Contracting
  • EPA www Web Snapshot
  • Grants
  • No FEAR Act Data
  • Plain Writing
  • Privacy
  • Privacy and Security Notice

Connect.

  • Data
  • Inspector General
  • Jobs
  • Newsroom
  • Regulations.gov
  • Subscribe
  • USA.gov
  • White House

Ask.

  • Contact EPA
  • EPA Disclaimers
  • Hotlines
  • FOIA Requests
  • Frequent Questions
  • Site Feedback

Follow.