
Results for Aerosol Treatment Technology Evaluation with the Knorr 3-Stage Air Filtration and Purification System
August 2, 2021 Report
Experimental Approach
A standard EPA, ASHRAE, or ASTM-approved method does not currently exist for evaluating efficacy of aerosol treatment products or devices against bioaerosols. Utilizing EPA’s specialized Aerosol Test Facility in Research Triangle Park, NC and experience in conducting research with aerosolized biological agents, a standardized approach that can be applied across multiple technology types was developed to achieve the objectives of this project. An objective of the test conditions was to maintain a high enough concentration of viable aerosolized test virus in the air for 90 minutes in control conditions (without technologies active) to be able demonstrate a 3-log (99.9%) reduction in airborne virus concentration during test conditions (with technologies active) relative to the time-matched control tests. For these tests, MS2, a nonpathogenic bacteriophage that infects Escherichia coli, was used as the test virus.
A large test section of the aerosol wind tunnel in EPA’s Aerosol Test Facility was sectioned off from the recirculating wind tunnel to serve as the test chamber utilized for this research. The 12 ft x 10 ft x 25 ft chamber provides a 3,000 ft3 conditioned space for dissemination and sampling of bioaerosols and for evaluating different aerosol treatment strategies (Figure 1). The chamber is temperature and relative humidity (RH) controlled, and its air is high-efficiency particulate air (HEPA)-filtered prior to each test. A mock heating, ventilation, and air conditioning (HVAC) system was designed and constructed in the test chamber to simulate air circulation and exchange rates typical of a wide range of general application settings. An Omni-Aire 1000V (Omnitec, Mukilteo, WA) negative air machine (NAM), with the HEPA filter removed, serves to represent a cold air return, recirculating air through the HVAC system and test chamber. Air then flows through the 8-inch main duct before passing through six evenly spaced 6-inch branches that distribute air back to the chamber through 10-inch round diffusers with butterfly dampers at the distribution points. The system was constructed from galvanized steel materials, and the NAM airflow rate is set to 350 cubic feet per minute (CFM), resulting in approximately 7 air changes per hour (ACH) in the chamber. No outside air is introduced during testing. Two metal fans (LASKO 2265 QM, West Chester, PA) placed in opposite corners of the chamber facilitate mixing, operating at 1448 ft/min. In between tests, the chamber is opened, and recirculated HEPA-filtered air is run through the chamber until negligible particle counts are present in the air in preparation for the next test.
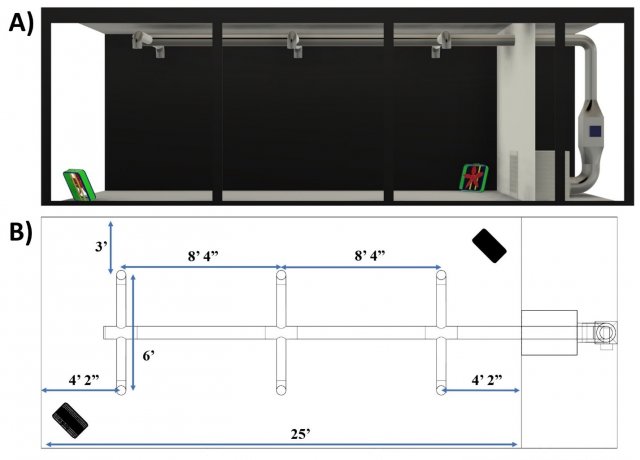
Figure 1. Test chamber schematics of A) side view and B) top-down view.
The bacteriophage MS2 (ATCC 15597-B1), a non-enveloped virus that infects the host cell Escherichia coli (ATCC 15597), was used in this current study. Conducting research with aerosolized viruses at these large scales necessitates the use of safer, e.g., Biosafety Level (BSL)-1 potential surrogate viruses, versus using more pathogenic agents, such as SARS-CoV-2 (BSL-3). As a non-enveloped virus, MS2 is expected to be more resistant to chemical inactivation than enveloped viruses (e.g., SARS-CoV-2). MS2 stock is prepared using a top agar overlay technique, and samples are analyzed using a plaque assay with the E. coli host.
In this study, four 6-jet Collison Nebulizers (CH Technologies, Westwood, NJ) are used to aerosolize MS2 into the test chamber. In each nebulizer, a 10 mL mixture of 1:4 parts MS2 stock (MS2 in SM Buffer) to 0.22 μm filter-sterilized deionized water with 6 drops of Antifoam A (Sigma-Aldrich, St. Louis, MO) is nebulized over a period of 10 minutes prior to the first bioaerosol sampling period. Aerosolized MS2 is sampled using SKC BioSamplers (SKC Inc., Eighty-Four, PA) connected to air sampling pumps that draw air at a rate of 12.5 L/min. The sampling period for each aerosol sample is 10 minutes, resulting in a total volume of 125 L of air sampled during each sampling period. Bioaerosol samples are taken in duplicate from a 5 ft “breathing zone” height during each sampling period. The first aerosol sample in each test is taken immediately following the 10-minute aerosolization period (time = 0 sample). The count median diameter of aerosolized particles is 44 ± 2 nm at the beginning of each test (time = 0 min), and it increases over the duration of the test to 85 ± 3 nm at the end of 90 minutes, as measured by a Scanning Mobility Particle Sizer (Model 3080 Electrostatic Classifier/TSI 3022 Condensation Particle Counter, TSI Inc., Shoreview, MN).
Knorr 3-Stage Air Filtration and Purification System Results
The Knorr Brake Company has developed a patented 3-Stage Air Filtration and Purification System for public transit vehicles, including tramway/light rail, metro, regional, and intercity passenger vehicles. This system can be installed either in newly built vehicles or retrofit into existing HVAC units. This technology was selected for evaluation based on prioritization from research stakeholders, including those in the transit industry. The system comprises the Merak Intense Field Dielectric (MIFD) filter, which uses an electrostatic discharge to charge a physical arrest filter, an Ultraviolet-C (UV-C) radiation component (one 30” 86W bulb with a peak wavelength at 254 nm), the Merak Dielectric Barrier Discharge (MDBD) bipolar ionization component, and two blower fans operated by one motor (to circulate air through the unit). The test unit evaluated in these laboratory studies was wired with a control box that allows individual actuation of each of the MIFD, UV-C, and MDBD modules (and the blower). The unit was placed in the middle of the test chamber (Figure 2), and tests were conducted with the NAM recirculating air through the HVAC system to facilitate mixing in the chamber (~7 ACH). Air flow through the Knorr blower was approximately 1255 CFM with the MIFD arrest filters in place and approximately 1350 CFM with the arrest filters removed, resulting in 25-27 ACH in the chamber, treated by the Knorr unit. All tests were conducted at 22 ± 2 °C and a RH of 30-35%[1]. This RH was selected because virus viability is reduced at intermediate RH[2], and an objective of the test design is to maintain a sufficiently high concentration of viable aerosolized MS2 after 90 minutes to allow for demonstration of a 3-log reduction in tests with technologies active relative to control conditions throughout the duration of each test. During each experiment, the Knorr blower was powered prior to MS2 aerosolization in order to circulate air through the unit. Following MS2 aerosolization, the time = 0 min sample was taken, and subsequently the component(s) to be evaluated was powered. The initial concentration of MS2 recovered at time = 0 min for each test and control experiment conducted was > 1x10⁷ plaque-forming units (PFU) per cubic meter (m3).
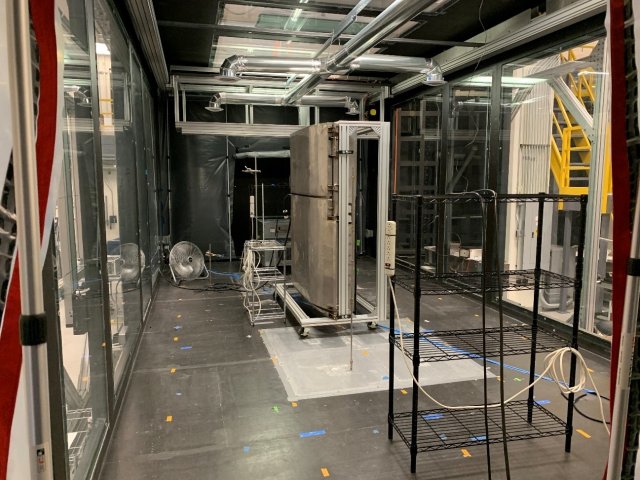
Figure 2. Location of the Knorr 3-Stage Air Filtration and Purification System in the middle of chamber during testing.
Figure 3 shows the concentration of MS2 at each sampling timepoint (normalized to the initial time = 0 min MS2 concentration) during each test. Three control tests were conducted on 6/16/21, 6/21/21, and 7/19/21 with only the Knorr unit’s blower on, and with the three components intact, but not powered. Three additional “No Filter” control tests were conducted on 6/22/21, 6/23/21, and 6/24/21, similar to the other control tests with only the blower powered, but with the arrest filters of the MIFD component removed. Three tests to evaluate the MIFD component powered alone were conducted on 6/28/21, 6/29/21, and 7/7/21. Both the MIFD and MDBD components were powered in tests conducted on 6/30/21, 7/1/21, and 7/8/21. All three components (MIFD, MDBD, and UV-C) were powered for tests conducted on 7/13/21, 7/14/21, and 7/15/21. Two tests were conducted with just the MDBD and UV-C components powered on 6/16/21 and 6/17/21. One test was conducted with the MDBD powered alone on 7/20/21. The component combinations run in triplicate were prioritized based on stakeholder interest in evaluating different configurations for installation in their vehicles.
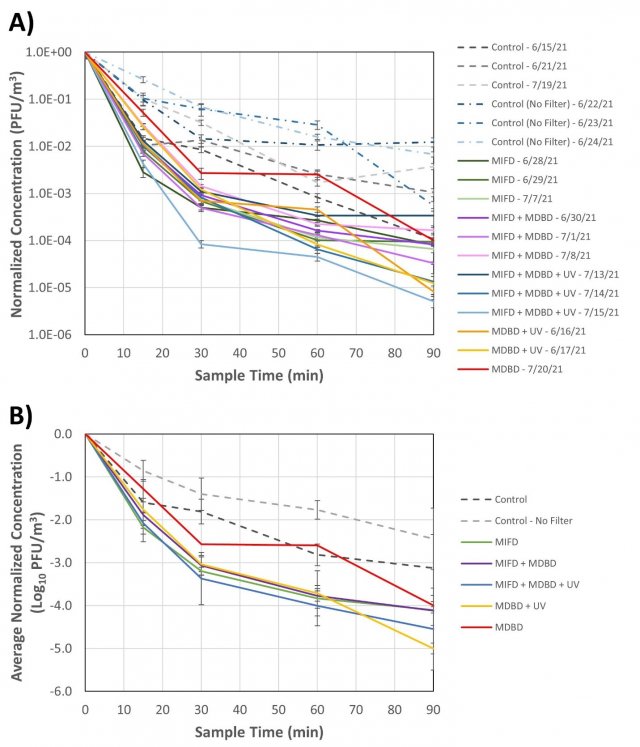
Figure 3. A) Concentration of MS2 recovered from aerosol samples throughout the control and Knorr components tests, normalized to the initial time = 0 min concentration for each test. Each timepoint represents recovery from duplicate bioaerosol samplers as determined by plaque assay, and the error bars represent pooled standard deviation at each sampling timepoint. B) Normalized log10 MS2 concentration at each sampling timepoint, averaged over each set of components tests (three replicates for each control and component test type, except for MDBD + UV [n=2] and MDBD [n=1]). Error bars represent standard deviation in averaged MS2 recoveries for each test condition. MIFD = Merak Intense Field Dielectric (MIFD) electrostatic filter; MDBD = Merak Dielectric Barrier Discharge (MDBD) bipolar ionization component; UV = UV-C radiation component.
Total particle (number) concentration, measured by a Scanning Mobility Particle Sizer (Model 3080 Electrostatic Classifier/TSI 3022 Condensation Particle Counter, TSI Inc., Shoreview, MN), was also recorded during each experiment. Figure 4 shows the particle concentration at each sampling timepoint during each test. Powering the MIFD lead to the greatest reduction in particle concentration, but particle concentrations were also reduced with the MDBD component operating. The arrest filter in the MIFD also reduced particle concentrations even when the filter was not charged.
Figure 4. Particle concentration measured at each timepoint during testing. Error bars represent standard deviation in measured particle concentration during each sampling timepoint.
Figure 5 shows the calculated log10 reduction in MS2 recoveries at each sampling timepoint between the average of the control tests with the arrest filter in place and the tests with components active (Figure 5A), as well as the calculated log10 reductions comparing the average of the control tests without the filter in place to the component tests (Figure 5B). All control and test conditions are represented by an average of three replicate tests, except for the MDBD + UV tests (two replicates) and the MDBD alone test (one replicate).
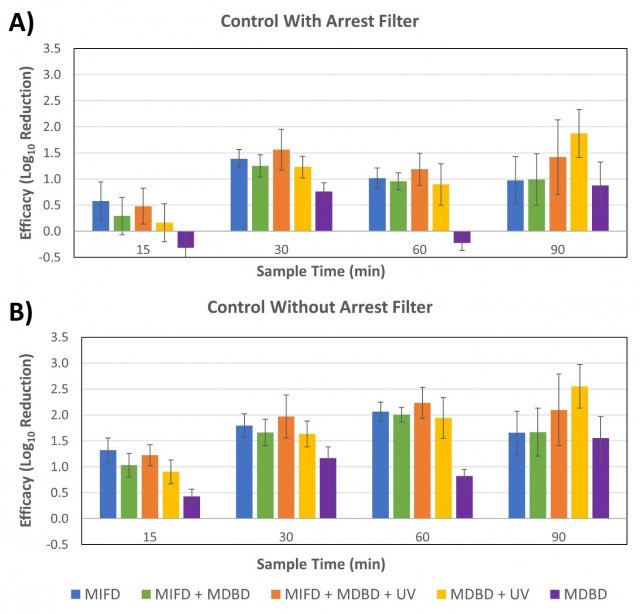
Figure 5. The calculated log10 reduction at each testing timepoint between the average recoveries of MS2 from the A) the control tests with the MIFD arrest filter in place and B) the control tests without the arrest filter in place. Error bars represent pooled standard error from the test and control experiments.
[1] EPA recommends that indoor relative humidity be maintained between 30% and 50% (https://www.epa.gov/iaq-schools/moisture-control-part-indoor-air-quality-design-tools-schools).
[2] Lin, Kaisen, and Linsey C. Marr. 2020. "Humidity-Dependent Decay of Viruses, but Not Bacteria, in Aerosols and Droplets Follows Disinfection Kinetics." Environmental Science & Technology 54 (2):1024-32. doi: 10.1021/acs.est.9b04959.