
GHGRP Suppliers of Petroleum Products
- Graphic of the Petroleum Product Supply Chain
- Trend of Reported CO2 Quantity
- Number of Reporters and Emissions
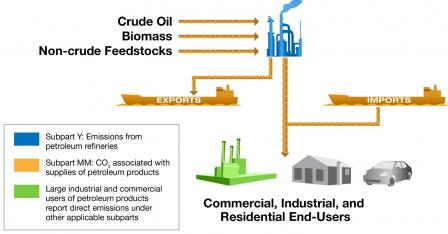
 This sector comprises petroleum refineries and importers and exports of petroleum products and natural gas liquids. These suppliers do not report direct emissions, but instead report the quantity of CO2 that would be emitted if the fuels and other products they supply each year were combusted. Petroleum refineries also report the volume of all feedstocks entering the refinery.
Emissions associated with these products do not occur at the supplier's facility but instead occur throughout the country, wherever they are used. The full GHG quantity reported by suppliers might not always result in GHG emissions, and the emissions might not take place during that particular reporting year. An example is ethylene, which is a byproduct from petroleum refining that is often used to produce plastics.
The GHG quantities reported by suppliers can be accessed through the suppliers section of FLIGHT. Petroleum refineries also report direct emissions under other applicable subparts.
Graphic of the Petroleum Product Supply Chain
Trend of Reported CO2 Quantity
What factors influenced the trends in emissions for suppliers of petroleum products?
Number of Reporters and Emissions in the Refinery Petroleum Products Sector (as of 8/16/2024)
| Petroleum Product Suppliers Sector - Number of Reporters | ||||||||||||
|---|---|---|---|---|---|---|---|---|---|---|---|---|
| Metric | 2012 | 2013 | 2014 | 2015 | 2016 | 2017 | 2018 | 2019 | 2020 | 2021 | 2022 | 2023 |
| Importers | 86 | 87 | 90 | 92 | 89 | 91 | 84 | 84 | 85 | 85 | 89 | 82 |
| Exporters | 60 | 61 | 64 | 64 | 69 | 72 | 68 | 63 | 66 | 66 | 73 | 72 |
| Petroleum Refineries | 137 | 136 | 136 | 137 | 136 | 137 | 135 | 136 | 136 | 132 | 130 | 129 |
| Petroleum Refineries – CO2 Quantity Associated with Supplied Productsa (million metric tons CO2) | ||||||||||||
|---|---|---|---|---|---|---|---|---|---|---|---|---|
| Metric | 2012 | 2013 | 2014 | 2015 | 2016 | 2017 | 2018 | 2019 | 2020 | 2021 | 2022 | 2023 |
| Petroleum Refineries | 2,150.7 | 2,320.2 | 2,393.3 | 2,443.8 | 2,474.0 | 2,514.8 | 2,574.9 | 2,514.9 | 2,216.6 | 2,312.4 | 2,449.8 | 2,453.7 |
a Carbon dioxide quantities shown in this table exclude petroleum refineries whose carbon dioxide quantities are considered confidential business information