GHGRP Reported Data
All greenhouse gas data presented here reflect the information reported to EPA as of August 19, 2018. The reported emissions exclude biogenic CO2. GHG data displayed are in units of carbon dioxide equivalent (CO2e) and reflect the global warming potential (GWP) values from Table A-1 Exit, which is generally based on the Intergovernmental Panel on Climate Change (IPCC)’s Fourth Assessment Report (AR4) Exit. The GWPs for some fluorinated GHGs that did not have GWPs in the AR4 are from the IPCC’s Fifth Assessment Report.
For reporting year (RY) 2017, over 8,000 facilities and suppliers reported to the greenhouse gas reporting program. Among these reporters,
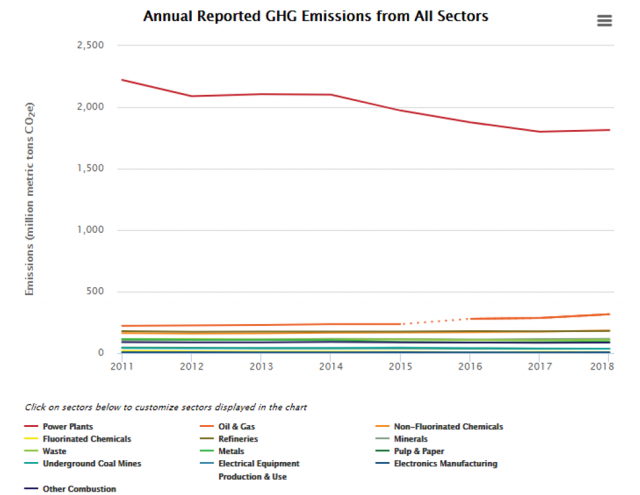
- 7,544 facilities in nine industry sectors reported direct emissions.
- Reported direct emissions totaled 2.91 billion metric tons carbon dioxide equivalent (CO2e), about half of total U.S. greenhouse gas emissions;
- 967 suppliers of fossil fuels and industrial gases reported; and
- 98 facilities reported injecting CO2 underground.
- Greenhouse Gas Reporting Program Background
- Who reports?
- Reported Emissions
- Emissions Trends
- Emissions by GHG
- Geographic Distribution of Emissions
- Emissions Range
- GHGRP Calculation Methods Used
- Report Verification
- For More Information
Greenhouse Gas Reporting Program Background
As directed by Congress, EPA’s Greenhouse Gas Reporting Program (GHGRP) collects annual greenhouse gas information from the top emitting sectors of the U.S. economy (Table 1). The GHGRP is the only dataset containing facility-level greenhouse gas (GHG) emissions data from large industrial sources across the United States. With seven consecutive years of reporting for most sectors, GHGRP data are providing important new information on industrial emissions—showing variation in emissions across facilities within an industry, variation in industrial emissions across geographic areas, and changes in emissions over time at the sector and facility level. EPA is using this facility-level data to improve estimates of national greenhouse gas emissions in the U.S. Greenhouse Gas Inventory.
This document summarizes national industrial sector emissions and trends.
Industry Sector | Number of Reporters | Emissions (Million Metric Tons CO2e) |
---|---|---|
Power Plants | 1,369 | 1,792.8 |
Petroleum and Natural Gas Systems | 2,253 | 284.4 |
Onshore Petroleum & Nat. Gas Prod. | 497 | 93.8 |
Offshore Petroleum & Nat. Gas Prod. | 141 | 7.0 |
Onshore Pet. & Nat. Gas Gathering & Boosting | 321 | 75.0 |
Natural Gas Processing | 449 | 55.8 |
Natural Gas Transmission/Compression | 529 | 24.2 |
Onshore Natural Gas Transmission Pipelines | 33 | 2.6 |
Underground Natural Gas Storage | 48 | 1.5 |
Natural Gas Local Distribution Companies | 169 | 13.5 |
Liquefied Natural Gas Import/Export Equp. | 6 | 3.8 |
LNG Storage | 6 | ** |
Other Petroleum & Natural Gas Systems | 79 | 7.4 |
Refineries | 144 | 177.4 |
Chemicals | 456 | 184.1 |
Non-Fluorinated Chemicals | ||
Adipic Acid Production | 3 | 9.1 |
Ammonia Manufacturing | 29 | 33.1 |
Hydrogen Production | 114 | 46.0 |
Nitric Acid Production | 32 | 9.5 |
Petrochemical Production | 67 | 53.7 |
Phosphoric Acid Production | 11 | 1.4 |
Silicon Carbide Production | 1 | 0.1 |
Titanium Dioxide Production | 6 | 2.3 |
Other Chemicals | 206 | 19.1 |
Fluorinated Chemicals | ||
Fluorinated GHG Production | 14 | 4.7 |
HCFC-22 Prod./HFC-23 Dest. | 4 | 5.2 |
Waste | 1,496 | 105.6 |
Industrial Waste Landfills | 171 | 8.1 |
MSW Landfills | 1,134 | 86.5 |
Solid Waste Combustion | 61 | 9.2 |
Industrial Wastewater Treatment | 137 | 1.9 |
Metals | 291 | 88.5 |
Aluminum Production | 7 | 2.7 |
Ferroalloy Production | 9 | 1.9 |
Iron and Steel Production | 122 | 72.6 |
Lead Production | 11 | 1.0 |
Magnesium Production | 7 | 0.5 |
Zinc Production | 5 | 0.6 |
Other Metals | 130 | 9.2 |
Minerals | 374 | 114.3 |
Cement Production | 94 | 66.8 |
Glass Production | 100 | 7.8 |
Lime Manufacturing | 75 | 29.3 |
Soda Ash Manufacturing | 4 | 5.4 |
Other Minerals | 103 | 5.0 |
Pulp and Paper | 222 | 35.8 |
Chemical Pulp and Paper Production | 115 | 10.4 |
Other Paper Producers | 107 | 25.5 |
Other | 1,308 | 130.1 |
Food Processing | 331 | 29.4 |
Ethanol Production | 173 | 19.4 |
Other Manufacturing | 275 | 14.5 |
Universities | 114 | 8.6 |
Military | 33 | 1.7 |
Other Combustion | 164 | 10.3 |
Underground Coal Mines | 78 | 37.5 |
Electronics Manufacturing | 51 | 6.1 |
Electrical Equipment Manufacturers | 6 | 0.2 |
Use of Electrical Equipment | 83 | 2.5 |
** Total reported emissions are less than 0.05 million metric tons CO2e.
The GHGRP does not represent total U.S. GHG emissions, but provides facility level data for large sources of direct emissions, thus representing the majority of U.S. GHG emissions. The GHGRP data collected from direct emitters represent about half of all U.S. emissions. When including greenhouse gas information reported to the GHGRP by suppliers, emissions coverage reaches approximately 85–90% (See Figure 1). The Inventory of U.S. Greenhouse Gas Emissions and Sinks: 1990-2016 contains information on all GHG emissions sources and sinks in the United States.
Learn more about the differences between the Inventory and the GHGRP.
Figure 1: U.S. Greenhouse Gas Inventory and the Greenhouse Gas Reporting Program
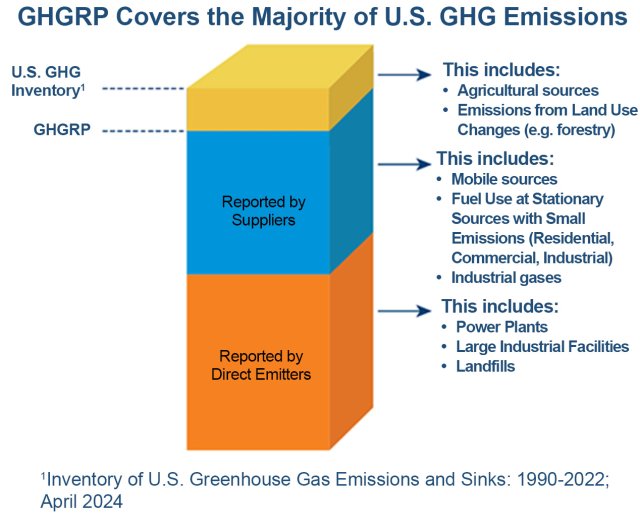
Suppliers report the quantity of GHGs that would be emitted if the fuels and industrial GHGs that they place into the economy each year are used/released. Reporting by suppliers helps account for the greenhouse gas emissions by the numerous low-emitting sources that are not required to report emissions under the GHGRP (e.g., mobile sources, residential sources). Learn more about suppliers and their 2017 reported data.
Direct emitters | |
---|---|
Number of facilities reporting | 7,544 |
Reported direct emissions (billion metric tons CO2e) | 2.91 |
Suppliers of fuel and industrial gases | |
Number of suppliers | 967 |
Underground injection of carbon dioxide | |
Number of carbon dioxide injection facilities | 98 |
Who reports?
For 2017, 7,544 direct emitters submitted a GHG report. The Petroleum and Natural Gas Systems sector had the largest number of reporting facilities, followed by the Waste Sector and the Power Plants Sector. Among suppliers, Suppliers of Natural Gas and Natural Gas Liquids had the largest number of reporting facilities.
Industry Sector | Number of Reporters1 |
---|---|
Power Plants | 1,369 |
Petroleum and Natural Gas Systems | 2,253 |
Refineries | 144 |
Chemicals | 456 |
Fluorinated Chemicals | 15 |
Non-fluorinated Chemicals | 441 |
Waste | 1,496 |
Metals | 291 |
Minerals | 374 |
Pulp and Paper | 222 |
Other | 1,308 |
Underground Coal Mines | 78 |
Electrical Equipment Production & Use | 89 |
Electronics Manufacturing | 51 |
Other Combustion | 1,090 |
1 Totals sum to more than 7,544 because facilities whose activities fall within more than one sector are counted multiple times.
Reported Emissions
In 2017, 2.91 billion metric tons CO2e were reported by direct emitters. The largest emitting sector was the Power Plants Sector with 1.8 billion metric tons CO2e, followed by the Petroleum and Natural Gas Systems Sector with 284 million metric tons (MMT) CO2e and the Chemicals Sector with 184 MMT CO2e (non-fluorinated and fluorinated chemicals combined). This information, as well as average emissions per reporter, is shown in the following chart.
Figure 2: Direct GHG Emissions Reported by Sector (2017)
View this information in FLIGHT.
Emissions Trends
National level trends in greenhouse gas emissions are available through the Inventory of U.S. Greenhouse Gas Emissions and Sinks: 1990-2016. The Greenhouse Gas Reporting Program is different from the U.S. GHG Inventory in that it collects information from the largest stationary sources in the U.S. and provides nearly complete emissions coverage for many of the largest emitting industries. Trends in emissions reported for individual industries are discussed in the industry-specific reports.
Total U.S. emissions decreased by 1.9 percent from 2015 to 2016, based on the U.S. GHG Inventory. For sources reporting to the GHGRP, excluding emissions from the oil and gas sector (which reported new source in 2016), emissions decreased by 4.0 percent from 2015 to 2016.
The U.S. GHG Inventory is not yet available for 2017. For sources reporting to the GHGRP, emissions decreased by 2.6 percent from 2016 to 2017. Over the past seven reporting years (2011-2017), GHGRP reported direct emissions from sectors other than oil and gas (also excluding suppliers) declined by 15.1 percent. This decline is primarily caused by a 19.3 percent decline in reported power plant emissions since 2011.
2011 | 2012 | 2013 | 2014 | 2015 | 2016 | 2017 | |
---|---|---|---|---|---|---|---|
U.S. GHG Inventory | |||||||
Total emissions (million metric tons CO2e) | 6,771.1 | 6,528.8 | 6,709.1 | 6,763.1 | 6,638.13 | 6,511.3 | Not available |
Percent change in emissions from previous year | — | -3.6% | 2.8% | 0.8% | -1.8% | -1.9% | Not available |
GHGRP | |||||||
Number of direct-emitting facilities | 7,645 | 7,896 | 7,982 | 8,205 | 8,041 | 7,672 | 7,544 |
Direct emissions (million metric tons CO2e) | 3,318.4 | 3,169.3 | 3,189.4 | 3,203.3 | 3,055.7 | 2,990.41 | 2,913.11 |
Percent change in emissions from previous year | — | -4.5% | 0.6% | 0.4% | -4.6% | -2.1% | -2.6% |
Sector | 2011 Emissions (MMT CO2e) | 2012 Emissions (MMT CO2e) | 2013 Emissions (MMT CO2e) | 2014 Emissions (MMT CO2e) | 2015 Emissions (MMT CO2e) | 2016 Emissions (MMT CO2e) | 2017 Emissions (MMT CO2e) |
---|---|---|---|---|---|---|---|
Power Plants | 2,221.7 | 2,089.5 | 2,105.8 | 2,101.7 | 1,972.5 | 1,876.7 | 1,792.8 |
Oil & Gas | 222.3 | 225.7 | 228.0 | 235.5 | 235.5 | 280.21 | 284.41 |
Chemicals | 180.4 | 173.0 | 174.5 | 177.1 | 177.3 | 177.3 | 184.1 |
Fluorinated Chemicals | 17.3 | 14.4 | 13.4 | 11.7 | 10.1 | 7.5 | 9.9 |
Non-fluorinated Chemicals | 163.1 | 158.6 | 161.1 | 165.4 | 167.3 | 169.8 | 174.2 |
Refineries | 178.2 | 172.6 | 174.3 | 175.3 | 175.3 | 179.3 | 177.4 |
Waste | 114.9 | 115.0 | 111.2 | 111.8 | 110.3 | 107.6 | 105.6 |
Metals | 112.0 | 106.8 | 106.9 | 104.4 | 90.8 | 86.8 | 88.5 |
Minerals | 103.2 | 107.8 | 111.5 | 117.0 | 115.1 | 110.6 | 114.3 |
Pulp & Paper | 44.2 | 42.8 | 39.4 | 39.3 | 38.4 | 37.7 | 35.8 |
Other | 141.6 | 136.0 | 137.7 | 141.4 | 140.5 | 134.1 | 130.1 |
Underground Coal Mines | 40.9 | 38.8 | 41.0 | 41.2 | 43.9 | 39.2 | 37.5 |
Electrical Equipment Production & Use | 4.3 | 3.4 | 3.4 | 3.3 | 2.8 | 3.2 | 2.7 |
Electronics Manufacturing | 7.0 | 6.4 | 5.2 | 6.2 | 6.3 | 6.2 | 6.1 |
Other Combustion | 89.5 | 87.4 | 88.1 | 90.6 | 87.4 | 85.5 | 83.9 |
1 GHG data for the Petroleum and Natural Gas Systems source category is not directly comparable between 2011-2015 and 2016 onward. Facilities in the Onshore Oil & Gas gathering & Boosting and Onshore Gas Transmission Pipelines industry segments began reporting in 2016.
Figure 3: Trends in Direct GHG Emissions (2011-2017) 1,2
View this information in FLIGHT.
1 Non-fluorinated Chemicals and Fluorinated Chemicals are components of “Chemicals” in FLIGHT.
2 Other Combustion, Underground Coal Mines, Electronics Manufacturing and Electrical Equipment Production & Use comprise “Other” in FLIGHT.
Emissions by GHG
Carbon dioxide is the GHG emitted in the largest quantities. The 2.6 billion metric tons of CO2 reported for 2017 represent 90.7 percent of the GHGs reported in 2017a. Methane emissions represent 7.7 percent of reported 2017 GHG emissions, N2O represents 0.9 percent, and fluorinated gases (HFCs, PFCs, SF6) represent 0.6 percent (Figure 4).
aThe Inventory of U.S. Greenhouse Gas Emissions And Sinks for 2017 is not yet available. In 2016, CO2 represented 82 percent of total U.S. GHG emissions.
Figure 4: Direct Emissions by GHG (2017)
The table below lists the primary sectors emitting each GHG.
Greenhouse Gas | Source Categories Contributing Most to Emissions1 | Sectors Contributing Most to Emissions |
---|---|---|
CO2 | Electricity Generation (D), Stationary Combustion (C) | Power Plants, Petroleum and Natural Gas Systems |
CH4 | Petroleum & Natural Gas Systems (W), Municipal Landfills (HH) | Petroleum and Natural Gas Systems, Waste |
N2O | Nitric Acid Production (V), Adipic Acid Production (E), Electricity Generation (D) | Chemicals, Power Plants |
SF6 | SF6 from Electrical Equipment (DD), Electronics Manufacturing (I) | Other, Metals |
NF3 | Electronics Manufacturers (I), Fluorinated Gas Production (L) | Other, Chemicals |
HFCs | HCFC–22 Production and HFC–23 Destruction (O), Fluorinated Gas Production (L) | Chemicals |
PFCs | Electronics Manufacturers (I), Fluorinated Gas Production (L) | Chemicals, Other |
1 These source categories account for 75 percent or more of the reported emissions of the corresponding GHG. The subpart under which the emissions were reported is shown in parentheses.
Geographic Distribution of Emissions
Figure 5: Location and Total Reported Emissions from GHGRP Facilities (2017)
This map shows the locations of direct-emitting facilities. The size of a circle corresponds to the quantity of emissions reported by that facility.
Readers can identify facilities in their state, territory, county, or city by visiting the Facility Level Information on GreenHouse gases Tool (FLIGHT).
Because it generally applies to facilities that emit greater than 25,000 metric tons CO2e per year, the GHGRP provides total reported emissions from large stationary sources in each state. Figure 6 shows the reported emissions in each state broken out by industrial sector.
Figure 6: Direct GHG Emissions by State and Sector (2017)
View this information in FLIGHT.
Emissions Range
The GHGRP provides a comprehensive dataset that can be used to determine the number of facilities at various emissions levels in many industry sectors. The GHGRP can also be used to determine the total GHG emissions from individual facilities, including emissions from fossil fuel combustion and other processes.
Figure 7: Percentage of All Reporting Facilities at Various Emission Ranges (2017)
Eighty percent of reporting facilities had emissions less than 250,000 metric tons CO2e. In 2017, the 613 largest-emitting facilities—those emitting more than one million metric tons CO2e—accounted for 2.05 billion metric tons CO2e. These emissions represent 70.4 percent of the total 2.91 billion metric tons CO2e reported. These high-emitting facilities are mainly power plants, but they also include facilities in all other direct emitter sectors.
You can use FLIGHT to list and sort facilities based on total reported emissions. This tool also allows you to sort facilities by specific industry types.
Figure 8: Facility Emission Ranges (2017)
GHGRP Calculation Methods Used
The GHGRP prescribes methodologies that must be used to determine GHG emissions from each source category. Reporters generally have the flexibility to choose among several methods to compute GHG emissions. The decision of which method to use may be influenced by the existing environmental monitoring systems in place and other factors. Reporters can change emission calculation methods from year to year and within the same year, as long as they meet the requirements for use of the method selected.
Additional information on the methodologies that reporters use to determine GHG emissions
Report Verification
All reports submitted to EPA are evaluated by electronic validation and verification checks. If potential errors are identified, EPA will notify the reporter, who can resolve the issue either by providing an acceptable response describing why the flagged issue is not an error or by correcting the flagged issue and resubmitting their annual GHG report.
Additional information describing EPA’s verification process in more details
For More Information
For more detailed information from each industrial sector, select an industrial sector from the left hand navigation menu.
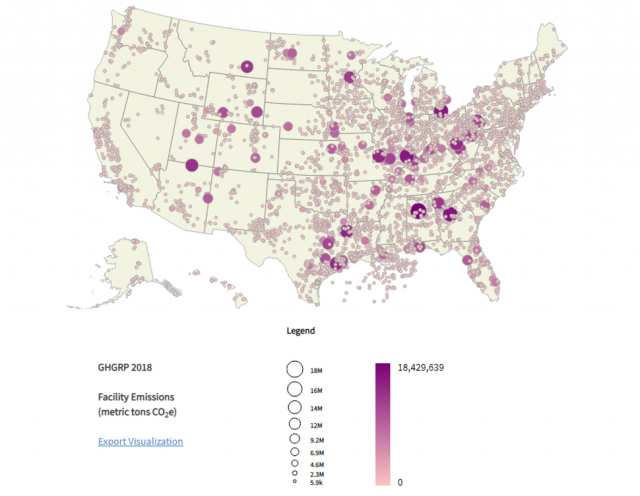
Use FLIGHT to view maps of facility locations, obtain summary data for individual facilities, create customized searchers, and display search results graphically.
Downloadable spreadsheets containing summary data reported to the GHGRP from each reporter are available on the Data Downloads page.
All other publicly available data submitted to the GHGRP are available for download through Envirofacts.
The U.S. Greenhouse Gas Inventory contains information on all sources of GHG emissions and sinks in the United States from 1990 to 2016.
All GHG emissions data reflect the global warming potential (GWP) values from the Fourth Assessment Report (AR4) of the Intergovernmental Panel on Climate Change (Climate Change 2007: The Physical Science Basis. Contribution of Working Group I to the Fourth Assessment Report of the Intergovernmental Panel on Climate Change [Core Writing Team, Pachauri, R.K. and Reisinger, A. (eds)]. IPCC, Geneva, Switzerland, 2007). The AR4 values also can be found in the current version of Table A-1 in subpart A of 40 CFR part 98.