
Lakes Presenting Risk for Exposure to Harmful Algal Toxins
About this indicator
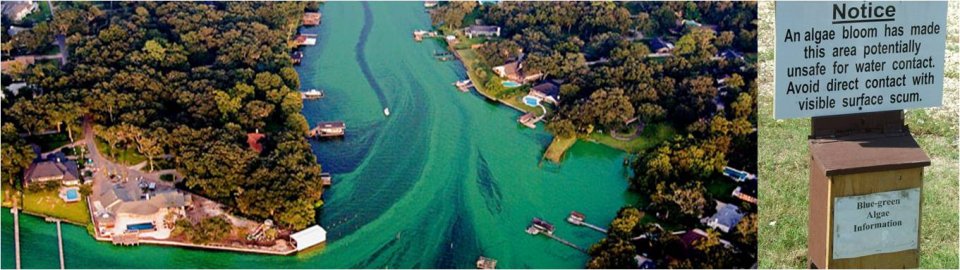
One of the potential effects of excess nutrients in lakes is the overgrowth of cyanobacteria, also known as blue-green algae, which produce toxins (cyanotoxins) that are harmful to people’s health and can kill fish, mammals and birds. When the density of such harmful organisms leads to the presence of scum on the lake surface or discoloration of the water, they are known as harmful algal blooms (HABs). The frequency and severity of HABs has been linked to increased nutrient loading from human activities (Lopez et al. 2008), and cyanobacterial HABs are considered one of the clearest indicators of excess nutrient concentrations (Paerl and Fulton, 2006). Cyanobacteria can produce neurotoxins (nervous system), hepatotoxins (liver) and dermatoxins (skin), posing a threat to human health when blooms occur in drinking water supplies. Additionally, cyanotoxins in recreational waters can pose a danger to people, pets, and livestock when they come in contact with the water.
The data presented here pertain to microcystins, and not other algae which may produce toxins. The data for this indicator are the number of lake visits sampled per state for microcystins during EPA’s 2017 National Lakes Assessment, and the number of samples which contained greater than EPA’s national recommended human health recreational criterion of 8 µg/l. When applied as a Clean Water Act section 304(a) water quality criterion, EPA recommends no more than 3 excursions (10-day assessment periods) within a recreational season per year. When used as a swimming advisory, EPA recommends the value not be exceeded on any single day.
| State | Number of Samples over 8 µg/l | Number of Lake Visits |
|---|---|---|
| Alabama | 0 | 10 |
| Alaska | NA | NA |
| Arizona | 0 | 15 |
| Arkansas | 0 | 10 |
| California | 0 | 26 |
| Colorado | 0 | 25 |
| Connecticut | 0 | 12 |
| Delaware | 0 | 9 |
| Florida | 0 | 18 |
| Georgia | 2 | 13 |
| Hawaii | NA | NA |
| Idaho | 1 | 28 |
| Illinois | 0 | 15 |
| Indiana | 2 | 52 |
| Iowa | 2 | 17 |
| Kansas | 0 | 17 |
| Kentucky | 0 | 11 |
| Louisiana | 0 | 16 |
| Maine | 0 | 26 |
| Maryland | 0 | 10 |
| Massachusetts | 0 | 12 |
| Michigan | 0 | 52 |
| Minnesota | 2 | 52 |
| Mississippi | 0 | 16 |
| Missouri | 0 | 19 |
| Montana | 0 | 33 |
| Nebraska | 1 | 30 |
| Nevada | 0 | 17 |
| New Hampshire | 0 | 13 |
| New Jersey | 0 | 13 |
| New Mexico | 0 | 15 |
| New York | 0 | 12 |
| North Carolina | 0 | 15 |
| North Dakota | 7 | 56 |
| Ohio | 0 | 18 |
| Oklahoma | 2 | 32 |
| Oregon | 1 | 51 |
| Pennsylvania | 0 | 18 |
| Rhode Island | 0 | 10 |
| South Carolina | 0 | 11 |
| South Dakota | 4 | 45 |
| Tennessee | 0 | 11 |
| Texas | 1 | 43 |
| Utah | 0 | 24 |
| Vermont | 0 | 12 |
| Virginia | 0 | 23 |
| Washington | 0 | 33 |
| West Virginia | 0 | 10 |
| Wisconsin | 1 | 54 |
| Wyoming | 0 | 21 |
Note - data should not be used to make statewide estimates of the percent of lakes presenting risk for exposure to microcystins.
Source: EPA's 2017 National Lakes Assessment.
Download the Toxins data table (xlsx)
Source of data
- U.S. EPA. 2017 National Lakes Assessment: The Third Collaborative Survey of Lakes in the United States. Office of Water and Office of Research and Development. Washington, DC.
- U.S. EPA (2022). National Lakes Assessment 2017: Technical Support Document. EA 841-R-22-001. U.S. EPA, Office Water and Office of Research and Development. Washington, DC.
Data source information
Data are from EPA’s 2017 National Lakes Assessment: The Third Collaborative Survey of Lakes in the United States (2022). In this study, EPA conducted a national survey of the condition of lakes, reservoirs and ponds, which included sampling for microcystins. Number of lake visits was obtained from table 2-2 in the 2017 National Lakes Assessment Technical Support Document. At each lake site, a sample was taken at a single station located at the deepest point in the lake, which would be expected to minimize the chance for false positives. Users may download the report and all the raw data directly from EPA’s National Lakes Assessment website Data from the National Aquatic Resource Surveys from the table entitled “National Aquatic Resource Surveys Data.”
What to consider when using these data
The lakes sampled for the 2017 National Lakes Assessment were chosen in a random, probability-based manner. However, while the base funding for the survey provided for the sampling of enough sites to make national and regional scale estimates of lake conditions, most states could not sample enough sites to allow for generation of state-level estimates. Therefore, the data shown here should not be extrapolated to make state-wide estimates of the percent of lakes presenting risk of exposure to microcystins. Users should also consider that the lake samples were collected for the survey at particular times during the summer of 2017, and the levels of microcystins are affected by spatial, temporal and climatic variables, such as season, temperature, and level of precipitation. Future assessments will continue to inform on the risk of exposure in different parts of the country.
References and links to other data sources
- Lopez, C.B., Jewett, E.B., Dortch, Q., Walton, B.T., and Hudnell, H.K. 2008. Scientific Assessment of Freshwater Harmful Algal Blooms. Interagency Working Group on Harmful Algal Blooms, Hypoxia and Human Health of the Joint Subcommittee on Ocean Science and Technology, Washington, DC.
- Hoagland, P. and Scatasta, S. 2006. The economic effects of harmful algal blooms, in Ecology of Harmful Algae, Graneli, E., Turner, J.T. (Eds.): Ecological Studies Series. Springer-Verlan, Heidelberg. Vol. 189, Chap. 30, pp. 391-402.
- Paerl, H.W. and Fulton, R.S. 2006. Ecology of harmful cyanobacteria, in Ecology of Harmful Algae, Granéli, E., Turner, J.T. (Eds.): Ecological Studies Series. Springer-Verlan, Heidelberg. Vol. 189, Chap. 8, pp. 95-109.
- Chorus, I. and Bartram, J. 1999. Toxic cyanobacteria in water: a guide to their public health consequences, monitoring and management. Published on behalf of WHO by E & FN Spon/Chapman & Hall, London.
- U.S. EPA. National Rivers and Streams Assessment.
- U.S. EPA. Wadeable Streams Assessment.
- U.S. EPA. National Wetland Condition Assessment.
- National Oceanic and Atmospheric Administration. National Ocean Service - Harmful Algal Blooms: Tiny Organisms with a Toxic Punch.