U.S. flag

An official website of the United States government

Here’s how you know

Dot gov

Official websites use .gov
A .gov website belongs to an official government organization in the United States.

HTTPS

Secure .gov websites use HTTPS
A lock (LockA locked padlock) or https:// means you’ve safely connected to the .gov website. Share sensitive information only on official, secure websites.

    • Environmental Topics
    • Air
    • Bed Bugs
    • Cancer
    • Chemicals, Toxics, and Pesticide
    • Emergency Response
    • Environmental Information by Location
    • Health
    • Land, Waste, and Cleanup
    • Lead
    • Mold
    • Radon
    • Research
    • Science Topics
    • Water Topics
    • A-Z Topic Index
    • Laws & Regulations
    • By Business Sector
    • By Topic
    • Compliance
    • Enforcement
    • Laws and Executive Orders
    • Regulations
    • Report a Violation
    • Environmental Violations
    • Fraud, Waste or Abuse
    • About EPA
    • Our Mission and What We Do
    • Headquarters Offices
    • Regional Offices
    • Labs and Research Centers
    • Planning, Budget, and Results
    • Organization Chart
    • EPA History

Breadcrumb

  1. Home
  2. Causal Analysis/Diagnosis Decision Information System (CADDIS)

Estimating Taxon-Environment Relationships: Placing Taxa into Tolerance Categories

  • Introduction
  • Using Taxon-Environment Relationships
  • Estimating Taxon-Environment Relationships
  • Computing Inferences
  • R Scripts
Helpful Links
Topics In Estimating Taxon-Environment Relationships
  • Overview 
  • Data Requirements
  • Central Tendencies
  • Environmental Limits
  • Parametric Regressions
  • Non-Parametric Regressions
  • Assessing Model Fit
  • Measurement Error
  • Survey Weighting
  • Placing Taxa into Tolerance Categories
Other Pages And Websites
  • Using R to Classify Curve Shapes

PECBO Appendix Site Map

Placing Taxa into Tolerance Categories

Taxa can be classified into three groups on the basis of the shape of their taxon-environment relationship: (1) monotonically increasing, (2) monotonically decreasing, or (3) unimodal (Yuan 2004). Then, when an increasing value of the environmental variable can be attributed to human activities, those taxa with monotonically increasing taxon-environment relationships are designated as tolerant, and those with monotonically decreasing relationships are designated as sensitive. Taxa with unimodal taxon-environment relationships are designated as intermediately tolerant.

The process of curve classification can be accomplished analytically or graphically, depending on whether parametric generalized linear model (GLM) or nonparametric generalized additive model (GAM)  regressions are used to define the taxon-environment relationship. In a parametric regression (see Equation 3 on Parametric Regression page), the curve can be classified according to the statistical significance of different coefficients in the regression. Specifically, if the quadratic term in Equation 3 reduces the model deviance by a statistically significant amount, then the relationship is unimodal. Otherwise, the model equation reduces to a linear relationship, and the relationship can be classified as either increasing or decreasing, depending upon the sign of the linear coefficient (b1 in Equation 3). In rare cases, the quadratic term is statistically significant but the sign of the coefficient (b2 in Equation 3) is positive, indicating that the relationship is concave up. In these cases, the data and the estimated taxon-environment relationship should be examined more carefully to identify reasons for the anomalous behavior.
 

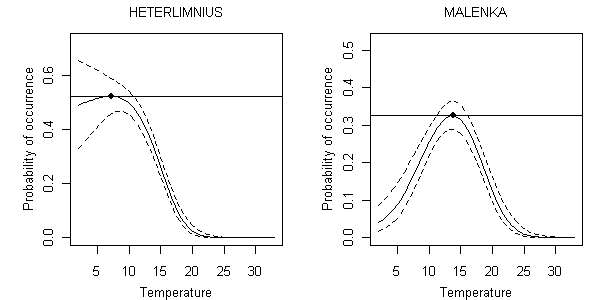
A graphical approach to curve classification is required for nonparametric regressions. The maximum modeled occurrence probability, in this case, is compared with the confidence limits on either side of the taxon optima. If a horizontal line drawn through the maximum mean occurrence probability deviates from the upper confidence limits on both sides of the taxon optima (e.g., Malenka in Figure 15), then the taxon is designated as unimodal. If the line deviates from the upper confidence limit only on the right-hand side of the taxon optimum (e.g., Heterlimnius in Figure 15), then the taxon is designated as a decreaser. If it deviates only on the left-hand side, then the taxon is designated as an increaser. A parallel set of conditions can be specified for the lower confidence limit. Assuming that human activities cause an increase in the value of the environmental gradient, increasers would be identified as tolerant taxa, decreasers would be identified as intolerant taxa, and unimodal taxa would be designated as intermediately tolerant.

Graphical approach for classifying curve shape for Heterlimnius and Malenka.
Figure 15. Graphical approach for classifying curve shape for Heterlimnius and Malenka. Solid line is mean response, dotted lines are estimated 90% confidence limits about mean response, solid horizontal line is location of maximum mean response for comparison with confidence limits.  Horizontal axis in units of degrees C.

Curve classifications allow taxa to be broadly characterized as tolerant or sensitive to changes in the value of specific environmental gradients. These tolerance classifications can then be useful for computing biological metrics. Statistical scripts for defining curve shape are available under the R Scripts tab of this Appendix.


References

  • U.S. EPA (2006) Estimation and Application of Macroinvertebrate Tolerance Values (PDF) (89 pp, 1.69 Mb, About PDF) (EPA/600/P-04/116F) Office of Research and Development, Washington, DC.
  • Yuan LL (2004) Assigning macroinvertebrate tolerance classifications using generalised additive models. Freshwater Biology 49:662-677.

Causal Analysis/Diagnosis Decision Information System (CADDIS)

  • CADDIS Home
    • About CADDIS
    • Frequent Questions
    • Publications
    • Recent Additions
    • Related Links
    • CADDIS Glossary
  • Volume 1: Stressor Identification
    • About Causal Assessment
    • Getting Started
    • Step 1. Define the Case
    • Step 2. List Candidate Causes
    • Step 3. Evaluate Data from the Case
    • Step 4. Evaluate Data from Elsewhere
    • Step 5. Identify Probable Causes
  • Volume 2: Sources, Stressors and Responses
    • About Sources
      • Urbanization
    • About Stressors
  • Volume 3: Examples and Applications
    • Analytical Examples
    • Worksheet Examples
    • State Examples
    • Case Studies
    • Galleries
  • Volume 4: Data Analysis
    • Selecting an Analysis Approach
    • Getting Started
    • Basic Principles & Issues
    • Exploratory Data Analysis
    • Basic Analyses
    • Advanced Analyses
    • PECBO Appendix
    • Download Software
    • Data Analysis Topics (A -Z)
  • Volume 5: Causal Databases
    • Learn about CADLink
Contact Us about CADDIS
Contact Us to ask a question, provide feedback, or report a problem.
Last updated on February 7, 2025
  • Assistance
  • Spanish
  • Arabic
  • Chinese (simplified)
  • Chinese (traditional)
  • French
  • Haitian Creole
  • Korean
  • Portuguese
  • Russian
  • Tagalog
  • Vietnamese
United States Environmental Protection Agency

Discover.

  • Accessibility Statement
  • Budget & Performance
  • Contracting
  • EPA www Web Snapshot
  • Grants
  • No FEAR Act Data
  • Plain Writing
  • Privacy
  • Privacy and Security Notice

Connect.

  • Data
  • Inspector General
  • Jobs
  • Newsroom
  • Regulations.gov
  • Subscribe
  • USA.gov
  • White House

Ask.

  • Contact EPA
  • EPA Disclaimers
  • Hotlines
  • FOIA Requests
  • Frequent Questions
  • Site Feedback

Follow.