U.S. flag

An official website of the United States government

Here’s how you know

Dot gov

Official websites use .gov
A .gov website belongs to an official government organization in the United States.

HTTPS

Secure .gov websites use HTTPS
A lock (LockA locked padlock) or https:// means you’ve safely connected to the .gov website. Share sensitive information only on official, secure websites.

    • Environmental Topics
    • Air
    • Bed Bugs
    • Cancer
    • Chemicals, Toxics, and Pesticide
    • Emergency Response
    • Environmental Information by Location
    • Health
    • Land, Waste, and Cleanup
    • Lead
    • Mold
    • Radon
    • Research
    • Science Topics
    • Water Topics
    • A-Z Topic Index
    • Laws & Regulations
    • By Business Sector
    • By Topic
    • Compliance
    • Enforcement
    • Laws and Executive Orders
    • Regulations
    • Report a Violation
    • Environmental Violations
    • Fraud, Waste or Abuse
    • About EPA
    • Our Mission and What We Do
    • Headquarters Offices
    • Regional Offices
    • Labs and Research Centers
    • Planning, Budget, and Results
    • Organization Chart
    • EPA History

Breadcrumb

  1. Home
  2. Causal Analysis/Diagnosis Decision Information System (CADDIS)

Estimating Taxon-Environment Relationships: Environmental Limits

  • Introduction
  • Using Taxon-Environment Relationships
  • Estimating Taxon-Environment Relationships
  • Computing Inferences
  • R Scripts

Environmental Limits

Helpful Links
Topics In Estimating Taxon-Environment Relationships
  • Overview
  • Data Requirements
  • Central Tendencies
  • Environmental Limits
  • Parametric Regressions
  • Non-Parametric Regressions
  • Assessing Model Fit
  • Measurement Error
  • Survey Weighting
  • Placing Taxa into Tolerance Categories
Other Pages And Websites
  • Using R to Estimate Environmental Limits
  • Weighted Average Inferences

PECBO Appendix Site Map

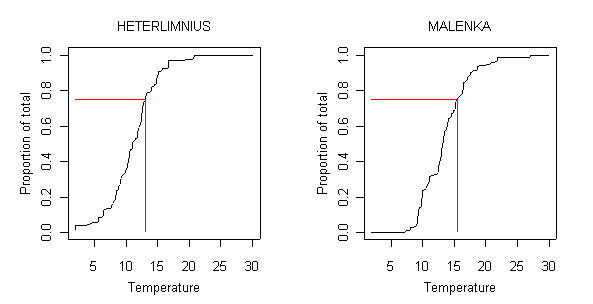
Taxon-environment relationships expressed in terms of environmental limits attempt to capture the maximum or the minimum level of an environmental variable under which a taxon can persist. Environmental limits can be estimated by computing cumulative percentiles (CPs) from field data. An empirical CP is estimated for a given value of the environmental variable, x0 , as follows (Equation 2):

EQUATION 2
EQUATION 2
where I = 1 if xi  < x0  and I = 0 if xi  > x0 , and other variables are as defined in Equation 1 (see the Central Tendencies link to in the Quick Links box). For presence/absence data, the numerator is the number of occurrences of taxon j at sites in which the value of the environmental variable is less than the cutoff value, and the denominator is the total number of occurrences of taxon j. Plots of CP as a function of x0 are shown in Figure 4 for two genera. An environmental limit would be estimated by fixing CP at a prescribed value and then computing the x0  that corresponds to that value of CP for each taxon. Then, x0  quantifies the limiting conditions for that taxon. To estimate the maximum level of an environmental variable under which a taxon could persist, CP would be fixed at a relatively high value (e.g., 0.75).
 
Empirical cumulative distribution method.
Figure 4. Empirical cumulative distribution method for defining environmental limits from relative abundance values of two genera. Cumulative percentile value shown is 0.75. Point at which red line intersects horizontal axis is the estimated environmental limit for that taxon. Horizontal axis in units of °C.
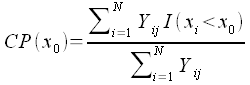
Statistical scripts for calculating cumulative percentiles are available under the R Scripts tab of this section.
 
Once environmental limits are computed for each taxon, one can use them to infer conditions at a new site based only on biological observations by computing a weighted average inference.

Causal Analysis/Diagnosis Decision Information System (CADDIS)

  • CADDIS Home
    • About CADDIS
    • Frequent Questions
    • Publications
    • Recent Additions
    • Related Links
    • CADDIS Glossary
  • Volume 1: Stressor Identification
    • About Causal Assessment
    • Getting Started
    • Step 1. Define the Case
    • Step 2. List Candidate Causes
    • Step 3. Evaluate Data from the Case
    • Step 4. Evaluate Data from Elsewhere
    • Step 5. Identify Probable Causes
  • Volume 2: Sources, Stressors and Responses
    • About Sources
      • Urbanization
    • About Stressors
  • Volume 3: Examples and Applications
    • Analytical Examples
    • Worksheet Examples
    • State Examples
    • Case Studies
    • Galleries
  • Volume 4: Data Analysis
    • Selecting an Analysis Approach
    • Getting Started
    • Basic Principles & Issues
    • Exploratory Data Analysis
    • Basic Analyses
    • Advanced Analyses
    • PECBO Appendix
    • Download Software
    • Data Analysis Topics (A -Z)
  • Volume 5: Causal Databases
    • Learn about CADLink
Contact Us about CADDIS
Contact Us to ask a question, provide feedback, or report a problem.
Last updated on February 7, 2025
  • Assistance
  • Spanish
  • Arabic
  • Chinese (simplified)
  • Chinese (traditional)
  • French
  • Haitian Creole
  • Korean
  • Portuguese
  • Russian
  • Tagalog
  • Vietnamese
United States Environmental Protection Agency

Discover.

  • Accessibility Statement
  • Budget & Performance
  • Contracting
  • EPA www Web Snapshot
  • Grants
  • No FEAR Act Data
  • Plain Writing
  • Privacy
  • Privacy and Security Notice

Connect.

  • Data
  • Inspector General
  • Jobs
  • Newsroom
  • Regulations.gov
  • Subscribe
  • USA.gov
  • White House

Ask.

  • Contact EPA
  • EPA Disclaimers
  • Hotlines
  • FOIA Requests
  • Frequent Questions
  • Site Feedback

Follow.