
Exposure Assessment Tools by Media - Air
Overview
Contaminated media to which people might be exposed include air, water and sediment, soil and dust, food, aquatic biota, and consumer products. Ambient air can become contaminated as a result of stationary (point) sources, natural sources, area sources, and mobile sources. Sources of indoor air pollution include combustion sources, building materials, and consumer products. Examples of combustion sources include oil, gas, wood, and tobacco products.
Exposure to contaminants in air can occur from direct contact (e.g., inhalation) or indirect contact. Indirect contact may occur from transfer and subsequent contact with other media. For example, deposition of atmospheric contaminants onto soil or water may subsequently be taken up into terrestrial foods or aquatic biota.
The concentrations of contaminants in air at the point of exposure may differ from the concentrations at the source as a result of fate and transport processes (e.g., dispersion or deposition).
Various tools are available for evaluating sources and releases of contaminants to air, fate and transport processes, and potential exposure concentrations.
EPA’s Technical Air Pollution Resources website provides access to technical information about many areas of air pollution prevention, technology, regulation, measurement, and science at:
Technical Air Pollution Resources
The Consumer Product Safety Commission (CPSC) and the Occupational Safety and Health Administration (OSHA) provide information and resources related to indoor air quality:
CPSC - The Inside Story: A Guide to Indoor Air Quality
OSHA - Safety and Health Topics: Indoor Air Quality
State and EPA Regional air websites are provided in the following tables.
| EPA Region | Website(s) |
|---|---|
| 1: Connecticut, Maine, Massachusetts, New Hampshire, Rhode Island, Vermont | Indoor Air Quality Air Toxics in New England |
| 2: New Jersey, New York, Puerto Rico , U.S. Virgin Islands | CAA Permitting |
| 3: Delaware, Maryland, Pennsylvania, Virginia, West Virginia, District of Columbia | CAA Permitting |
| 4: Alabama, Florida, Georgia, Kentucky, Mississippi, North Carolina, South Carolina, Tennessee | CAA Permitting |
| 5: Illinois, Indiana, Michigan, Minnesota, Ohio, Wisconsin | EPA Region 5 |
| 6: Arkansas, Louisiana, New Mexico, Oklahoma, Texas | CAA Permitting |
| 7: Iowa, Kansas, Missouri, Nebraska | CAA Permitting |
| 8: Colorado, Montana, North Dakota, South Dakota, Utah, Wyoming | Region 8 Air Program |
| 9: Arizona, California, Hawaii, Nevada, territories of Guam and American Samoa | Region 9 Air Programs |
| 10: Alaska, Idaho, Oregon, Washington | EPA Region 10 |
Sources
Contamination of ambient or indoor air can occur from anthropogenicResulting from human activity. sources or natural sources.
- Anthropogenic sources include point or stationary sources, area sources, mobile sources, and various indoor sources.
- Natural sources of air contamination include the earth’s crust, wildfires, volcanic eruptions, and biota. Some natural sources (e.g., radon gas from the earth’s crust) may become indoor air contaminants as a result of vapor intrusion through building foundations or basements.
Outdoor Air
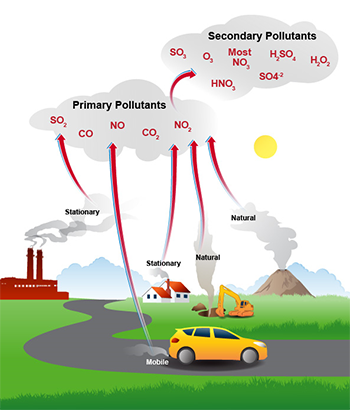
Source: U.S. EPA
There are many sources of outdoor air pollution.
- Point sources are a type of stationary source that include factories and other manufacturing plants, incinerators, and furnaces.
- Area sources are stationary sources. They include small businesses such as dry cleaners and auto body shops, home heating units such as woodstoves, and outdoor burning. Emissions generated by agricultural and forestry practices such as windblown dust from tillage, ammonia from animal wastes, and prescribed burning of crop residue are also classified as area sources. They can be important contributors to the total inventory of releases.
- Mobile sources of air contamination include on-road vehicles and engines (e.g., cars, trucks, buses, motorcycles) and nonroad vehicles and engines (e.g., locomotives, watercraft, aircraft, lawn and garden equipment). EPA's Office of Transportation and Air Quality (OTAQ) provides information on transportation-related sources.
- Examples of natural sources of air pollution include gases emitted by the earth’s crust (e.g., radon); smoke and carbon dioxide (CO2) released during forest fires; particulate matter and gases from volcanic eruptions; volatile organic compounds (VOCs) released by some vegetation; and methane from digestive processes of some animals.
Under the Clean Air Act, EPA has set national air quality standards for six common air pollutants (see EPA Air Emission Sources for more information):
- Carbon monoxide (CO)
- Ozone (O3)
- Lead
- Particulate matter (PM)
- Nitrogen dioxide (NO2)
- Sulfur dioxide (SO2)
Data banks such as the Toxics Release Inventory (TRI) provide information on onsite releases and disposal of toxic chemicals to air that are reported annually by industries. These types of data sets may be used to identify the sources and levels of specific air toxics of concern and to evaluate potential exposures and risks.
Emission factors are fundamental tools used in developing inventories of air pollutant sources. They can be used in estimating releases to the environment, making air quality management decisions, and developing emission control strategies.
- EPA’s AP-42 provides emission factors for various source categories (i.e., industry sectors or groups of similarly-emitting sources). These emission factors have been developed from source test data, material balance studies, and engineering estimates.
- The Clearinghouse for Inventories and Emissions Factors (CHIEF) provides information on emissions inventories and emissions factors.
Indoor Air
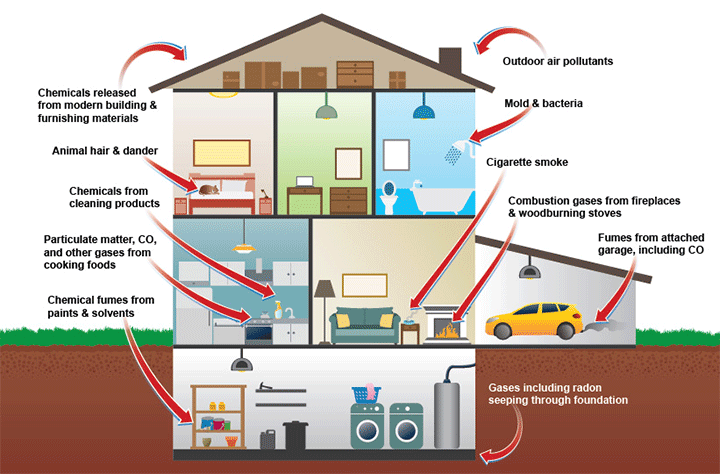
Source: U.S. EPA
There are many sources of indoor air contaminants. These contaminants can enter buildings from the outside or are generated inside (see figure).
People spend a lot of time indoors. According to Chapter 16 of EPA’s Exposure Factors Handbook: 2011 Edition, an adult aged 18–64 years spends on average 1,159 minutes (i.e., more than 19 hours) indoors per day (U.S. EPA, 2011). An average child aged <18 years spends even more time indoors per day (U.S. EPA, 2011). Of course, these estimates might vary from region to region and by season.
Indoor-generated air pollution can result from the following:
- Combustion of oil, gas, kerosene, coal, wood, and tobacco products
- Building materials and furnishings
- Consumer products (e.g., products used for household cleaning and maintenance, personal care, or hobbies)
- Central heating and cooling systems and humidification devices
Outdoor pollution can also penetrate into a building. Vapor intrusion generally occurs when there is a migration of volatile chemicals from contaminated groundwater or subsurface soil into an overlying building. Volatile chemicals can enter buildings through cracks in the foundation and openings for utility lines.
Radon and ozone are examples of two pollutants formed outside the home that can travel to indoor living spaces. Radon is generated by certain types of rock and can accumulate in (or under) a home following emission from the ground.
Some sources of indoor air pollutants (e.g., building materials and furnishings) release pollutants more or less continuously. Others (e.g., smoking or use of household cleaning products) release pollutants intermittently.
Indoor contaminants are primarily advected and dispersed on a relatively large scale by heating and air conditioning systems or natural ventilation. (See the Chemical Classes Tool Set of EPA ExpoBox for additional information and resources for specific contaminants.
EPA’s Indoor Air Quality (IAQ) website contains information on various indoor air contaminants, including:
- Asbestos
- Pesticides
- Biological pollutants (e.g., mold)
- Radon
- Environmental tobacco smoke
- Respirable particles
- Lead
The IAQ website also provides links to several resources, including Tools for Schools and the Building Codes and Indoor Air Quality tool. Descriptions for these resources and others that describe sources and releases to indoor air and general information on indoor air quality are included in the table below.
Fate and Transport
Fate and transport processes “link” the release of contaminants at a source with the resultant environmental concentrations to which receptors can be exposed. When a contaminant is released from a source, it is subject to transportMovement within a medium or between media. and transformationChange in a chemical or physical state. in the environment. Compounds can also transfer from an environmental medium to biota.
| Migration Process | Examples Relevant to Air |
|---|---|
| Transport |
|
| Transformation |
|
| Transfer – Environment to Biota |
|
For additional information on the uptake of contaminants from plants to animals used as a source of food, see the Food Module in the Media Tool Set of EPA ExpoBox. For additional information on the uptake of contaminants from water to fish, refer to the Aquatic Biota Module in the Media Tool Set.
Indoor or outdoor dust that is airborne represents a potential inhalation exposure and is therefore relevant to the discussion of air contaminants provided in this module. Settled dust that represents potential dermal and ingestion exposures is discussed as part of the Soil and Dust Module in the Media Tool Set.
Several information sources, models, and calculation tools are available for characterizing air dispersion and transport of contaminants to other media. Many of these resources are described within this module. Consideration of other media affected by air contaminants is important when evaluating aggregate exposure from multiple exposure pathways.
Data
After pollutants are released to the atmosphere, their transport, dispersion, and transformation are governed by several factors including:
- Meteorological factors (e.g., wind, temperature, precipitation)
- Terrain characteristics (e.g., amount and type of vegetation, presence of water bodies)
- Wet and dry deposition rates
- Certain physicochemical properties of the air pollutant (see box on right)
Physicochemical properties data will help determine whether a chemical is likely to remain in the air, partition to other media, or transform physically, chemically, or biologically after release. Physicochemical properties data may be determined by measurements or estimated based on chemical structure. Use of chemical-specific measured values is typically preferred.
Variability in the indoor air concentrations can be influenced by indoor/outdoor exchange rates, heating and air conditioning systems, and building ventilation rates.
There are a number of sources that provide data that are useful in predicting fate and transport of contaminants in air.
Models
Fate and transport models can be used to estimate concentrations of contaminants at the point-of-contact for a receptor population. Models might also be used to describe the multimedia transport and fate of pollutants from air to other media. For example, air contaminants could be deposited onto soil and taken up by plants that are consumed by animals used a source of food. They also could be deposited onto water that may be used as a source of drinking water, recreation such as fishing or swimming, or crop irrigation.
Some ambient air models describe dispersion and deposition only. Others also estimate exposure concentrations and allow users to characterize risk to potential receptors. Likewise, some indoor air models estimate concentrations based on fate and transport processes as well as quantify individual exposure and risk based on activity patterns and source use.
Concentrations
Concentrations of contaminants in the air are needed for assessing exposure via the inhalation route (see Inhalation Module in the Routes Tool Set of EPA ExpoBox). Air concentrations may also be used as data inputs for modeling the fate and transport of contaminants in air, including deposition and/or uptake into other media.
Characterizing contaminant concentrations for an exposure scenario is typically accomplished using some combination of the following approaches:
- Sampling air and measuring contaminant concentrations
- Modeling the concentrations based on source strength, media transport, and chemical transformation processes
- Using existing, available measured concentration data collected for related analysis or compiled in databases
EPA ExpoBox provides information on measuring or modeling air concentrations and on available air monitoring data. Information on sampling methods is available to support the measurement of contaminants in air.
Air concentrations may be measured in outdoor (ambient) or indoor environments or in the breathing zone of individuals. In the absence of monitoring data, a variety of models can be used to estimate contaminant concentrations in air and characterize their fate and transport in other media.
Measuring Concentrations
Information on sampling and analytical methods for measuring concentrations of contaminants in air is provided here. In general, there are two types of air sampling devices used - active and passive.
- Active sampling depends on pumping or similar processes that force movement through an appropriate collection device.
- Passive sampling involves nonmechanical processes like diffusion without any active movement of the medium (U.S. EPA, 2004). In an outdoor environment, passive sampling devices would more likely be influenced by changing environmental conditions such as wind speed and temperature.
Personal monitoring is useful for identifying chemical concentrations at the point-of-contact (e.g., individual exposure). It can be performed using active or passive sampling devices. It might be particularly useful to collect personal monitoring samples in the breathing zone of individuals (e.g., workers) who are closest to a source.
Measured concentrations of pollutants in ambient or indoor air could be used with fate and transport models (e.g., dispersion models) or other calculation tools to help characterize exposure.
Modeling Concentrations
In the absence of monitoring data, models such as those described in the table below, may be used to estimate the concentrations of contaminants in air. Models may also be used in conjunction with monitoring data to estimate air concentrations at the point-of-contact with receptors, considering fate and transport processes.
Air quality models use ambient measurements or emission factors along with other data and mathematical formulations to estimate concentrations at the point of exposure.
- EPA’s Support Center for Regulatory Atmospheric Modeling (SCRAM) provides access to a variety of models that can be used to “simulate the physical and chemical processes that affect air pollutants as they disperse and react in the atmosphere” along with supporting documentation and guidance.
Several different types of air quality models are available including dispersion models, photochemical models, and receptor models.
| Model Type | Characteristics |
|---|---|
| Dispersion Model |
|
| Photochemical Model |
|
| Receptor Model |
|
Indoor air quality models allow users to perform indoor air quality simulations that consider emissions sources, sinks, heating, ventilating, air conditioning (HVAC) systems, and air cleaning devices. Some models are designed to quantify individual exposures and characterize risks associated with indoor air pollutants based on activity patterns and source use.
Available Data
Under the Clean Air Act, EPA establishes air quality standards to protect public health and the environment. EPA has set national air quality standards for six priority pollutants:
- carbon monoxide
- ozone
- lead
- nitrogen dioxide
- particulate matter, and
- sulfur dioxide
EPA has created monitoring networks across the country to assess air quality trends for these and other hazardous air pollutants.
There are a number of information sources that provide monitoring data on contaminant concentrations in ambient air (see table below). These databases provide ambient air concentrations of contaminants at the national level and for other broad geographic areas such as cities, counties, and states.
Surveys that provide indoor air quality (IAQ) data on a large geographic scale are limited. Two examples are the BASE and TEAM studies.
- The Building Assessment Survey and Evaluation (BASE) Study was conducted to assess indoor air quality from 100 randomly selected public and commercial office buildings located in 37 cities and 25 states. Data were collected on levels of inhalable particles (PM2.5 and PM10), VOCs, formaldehyde, bioaerosols, and radon.
- The Total Exposure Assessment Methodology (TEAM) Study measured exposures to 20-25 VOCs in the air, drinking water, and exhaled breath of over 600 individuals in 4 states. The TEAM researchers concluded that indoor air in the home and at work far outweighs outdoor air as a route of exposure to toxic chemicals. The elevated indoor levels appeared to be associated with building materials, consumer product use, and personal activities such as smoking.
Summaries of other IAQ projects and links to a number of project reports are provided at EPA’s IAQ publications website (see Indoor Air - Publications).
In addition, information from EPA is available that provides general pollutant concentration levels believed to be “typical” in the home for VOCs, lead, nitrogen dioxide, formaldehyde, carbon monoxide, and respirable particulates (see links to specific air pollution sources at Indoor Air - An Introduction to Indoor Air Quality).
Exposure Scenarios
Exposure to contaminants in ambient or indoor air can be estimated by first defining the exposure scenarioA set of facts, assumptions, and inferences about how exposure takes place that aids the exposure assessor in evaluating or quantifying exposure. of interest. Exposure scenarios typically include information on the sources and pathways of exposure, contaminants of concern, and receptor populations. They might also describe a receptor population’s activities that may affect exposure and the timeframe over which exposure occurs.
For an inhalation exposure scenario, concentrations of the contaminants in air (modeled or measured) are needed to estimate exposure dose. Information about the receptor population(s) is also important. Adults and children could be exposed to contaminated air during a variety of activities in different environments. Exposures might occur over short durations (e.g., more than 24 hours, up to 30 days) or longer timeframes (e.g., more than 30 days).
After characterizing the exposed population and identifying exposure concentrations, it is important to define all appropriate exposure factor inputs. Information on exposure factors can be obtained from the Exposure Factors Handbook: 2011 Edition (see Exposure Factors tab in the Indirect Estimation Module of the Approaches Tool Set).
The table below provides some examples of scenarios involving air contaminants. The list of examples is not meant to be exhaustive; there are numerous other inhalation exposure scenarios that may be constructed based on the specific needs of the assessment. There are also numerous variations of the examples provided in the table.
Additional information on exposure scenarios involving contaminated air may be found in the Indirect Estimation Module in the Approaches Tool Set of EPA ExpoBox.
| Source/Pathway | Population | Activity/Timeframe | Inhalation Rate | Exposure Period |
|---|---|---|---|---|
| Ambient air | General population; adults | Routine activity; long-term; adjusted air concentration | Not applicable | Chronic |
| Ambient air; contaminated site | School children | Playing during time spent in elementary school; dose calculation [Table 16-17] | Short-tem, activity-specific [Table 6-2] | Sub-chronic |
| Ambient air; source-related contaminant | Highly-exposed local population; adults and children | Routine; long-term-dose calculation | Daily [Table 6-1] | Chronic or sub-chronic, depending on lifestage |
| Outdoor air; particulates from contaminated site | Occupational; adults | Site-specific construction; short-term; adjusted air concentration | Not applicable | Acute |
| Indoor air | Infants or home-bound elderly adults | Routine; less than lifetime; adjusted air concentration | Not applicable | Sub-chronic |
| Indoor air | Occupational | Working in contaminated office building; long-term occupational; adjusted air concentration [Table 16-8] | Not applicable | Chronic |
| Indoor air; consumer product use | Consumers | Cleaning with same consumer product over long timeframe [Chapter 17] | Short-term, activity-specific [Table 6-2] | Chronic |
| Indoor air; vapor intrusion from under-foundation source | Residential adults and children | Routine over lifetime; adjusted air concentration | Not applicable | Chronic |
| Indoor air; volatilization from water while showering | Residential adults and children | Showering daily [Table 16-1] | Short-term, activity-specific [Table 6-2] | Chronic or sub-chronic, depending on lifestage |
| Outdoor or indoor air; volatilization from swimming pool water | Recreators | Swimming over less than lifetime [Table 16-1] | Short-term, activity-specific [Table 6-2] | Sub-chronic |
| Indoor air; contamination in vehicle | Commuters; adults | Traveling in vehicle to and from work; less than lifetime [Table 16-24] | Short-term, activity-specific [Table 6-2] | Sub-chronic |
Several resources are available that illustrate inhalation exposure scenarios.
Exposure Factors
To estimate human exposure to contaminants in ambient or indoor air, exposure factor information is needed. Exposure factors are human behaviors and characteristics that help determine an individual's exposure to an agent. When determining inhalation risk, inhalation rate and body weight might not be needed (see right).
When inhalation rates are needed, data are available in Chapter 6 of EPA’s Exposure Factors Handbook: 2011 Edition. Long-term inhalation rates are reported as daily rates in units of m3/day or m3/kg-day. Short-term rates are described for various activities (e.g., walking, running, playing, housework, yard work) or activity levels (e.g., light, moderate, heavy) in units of m3/minute.
Inhalation rates should be selected to represent the appropriate age/lifestage, sex (if appropriate), timeframe, and, if applicable, activity or activity level for the exposure scenario of interest.
Other activity-specific factors that may be relevant for assessing inhalation exposures associated with specific activity levels are available in Chapter 16 of the Handbook. These might include amount of time spent indoors, outdoors, or doing a specific activity (e.g., household work, physical leisure activities, passive leisure activities).
Other exposure factors that might be needed for assessing inhalation exposures include:
- Body weight (Chapter 8)
- Consumer product use (Chapter 17)
- Life expectancy values, specifically when evaluating cancer risk (Chapter 18)
- Building characteristics when assessing indoor air exposures (Chapter 19)
References
- U.S. EPA. (2004). Identification of Time-integrated Sampling and Measurement Techniques to Support Human Exposure Studies. (EPA/600/R-04/043). Washington, DC.
- U.S. EPA. (2009). Risk Assessment Guidance for Superfund Volume I: Human Health Evaluation Manual (Part F, Supplemental Guidance for Inhalation Risk Assessment): Final. (EPA/540/R-07/002). Washington, DC.
- U.S. EPA. (2011). Exposure Factors Handbook 2011 Edition (Final). (EPA/600/R-09/052F). Washington, DC.