U.S. flag

An official website of the United States government

Here’s how you know

Dot gov

Official websites use .gov
A .gov website belongs to an official government organization in the United States.

HTTPS

Secure .gov websites use HTTPS
A lock (LockA locked padlock) or https:// means you’ve safely connected to the .gov website. Share sensitive information only on official, secure websites.

    • Environmental Topics
    • Air
    • Bed Bugs
    • Chemicals and Toxics
    • Climate Change
    • Emergency Response
    • Environmental Information by Location
    • Environmental Justice
    • Greener Living
    • Health
    • Land, Waste, and Cleanup
    • Lead
    • Mold
    • Pesticides
    • Radon
    • Science Topics
    • Water Topics
    • A-Z Topic Index
    • Laws & Regulations
    • By Business Sector
    • By Topic
    • Compliance
    • Enforcement
    • Guidance
    • Laws and Executive Orders
    • Regulations
    • Report a Violation
    • Environmental Violations
    • Fraud, Waste or Abuse
    • About EPA
    • EPA Administrator
    • Organization Chart
    • Staff Directory
    • Planning, Budget, and Results
    • Jobs and Internships
    • Headquarters Offices
    • Regional Offices
    • Lab and Research Centers
Toxics Release Inventory (TRI) Program
Contact Us

TRI Pollution Prevention (P2) Resources

TRI P2 Data Overview Screen Shot

EPA has resources to help industrial facilities report pollution prevention (P2) information to the Toxics Release Inventory (TRI) Program, access and analyze P2 data, and share P2 best practices.

TRI P2 Overview

  • About TRI's Pollution Prevention (P2) Data (pdf) (2/13/2020) : General fact sheet about TRI P2 data.
  • TRI P2 Data Overview (pdf) (2/13/2020) : Summary of available P2 data and discussion of the increase in the amount of P2 data reported by facilities from 2011 to 2018.
  • How TRI P2 Data Can Benefit Your Facility (pdf) : Handout identifying the benefits of reporting and using TRI's P2 data, and the easiest ways to access the information.
  • Benefits of Pollution Prevention (pdf) : Handout describing and quantifying--the benefits of implementing pollution prevention practices for facilities and surrounding communities.

Reporting P2 to TRI

  • TRI Source Reduction Webpage: Key information includes an interactive plant diagram for learning about source reduction categories and how they may apply to your facility.
  • TRI Green Chemistry & Engineering webpage: Learn more about green chemistry and engineering practices and the codes used to report these activities.
  • TRI Source Reduction Reporting Fact Sheet (pdf) (October 2019) : Answers to common questions about the reporting of required and optional information on annual TRI forms.
  • TRI P2 Reporting Tips (pdf) : Overview for facilities of the benefits of reporting P2 activities to the TRI Program and guidance on how to describe P2 activities in Section 8.11 of the TRI Form R.
  • TRI P2 Reporting Tutorials:
    • How to calculate a production or activity ratio (section 8.9),
    • How to report source reduction activities (section 8.10), and
    • How to provide additional details on P2 achievements or other TRI aspects (section 8.11 and 9.1).

How-To Guidance

  • How to Access P2 Data Reported to TRI Using the P2 Search Tool: 14-minute video describing query options, the facility P2 profile report, and the parent company comparison report.
    P2 Search Tool Screen Shot
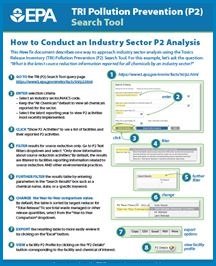
  • How to Conduct an Industry Sector P2 Analysis (pdf) : Step-by-step guide to using the TRI P2 Search Tool for industry analysis. 
  • How to Find Facilities Implementing Source Reduction Activities (pdf) (12/14/21) : Step-by-step guide to using the TRI P2 Search Tool to identify facilities that have reported source reduction activities.
  • How to use TRI P2 data to help green supply chains (pdf) : General information on the value of greening supply chains and how to query for supplier-related text entries.
  • TRI, P2, and Automotive Suppliers (pdf) : Supplier information specific to the automotive industry sector.
  • How to identify and compare P2 performance at the facility and corporate level: Presentation slides and recording from February 2015 webinar.

Videos


Video about a Minneapolis-based bakeware manufacturer that uses TRI data to identify ways to reduce the use of certain toxic chemicals in its processes and finished products. October 2016.

Video for TRI reporting facilities on the benefits of reporting pollution prevention information to TRI, with perspectives from industry and EPA. February 2015.

Other Resources

Is Source Reduction Effective infographic
Learn about the impacts of source reduction
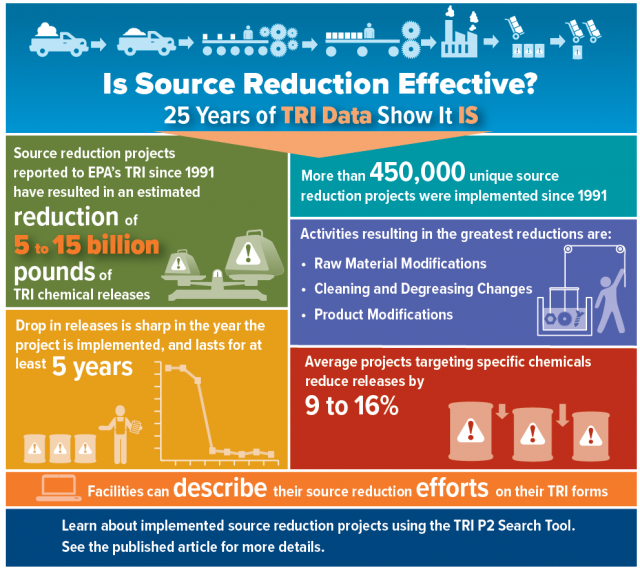
  • Browse the TRI P2 Analyses and Publications for information on P2 opportunities and the benefits of P2 implementation.
  • Learn about other EPA resources including EPA’s P2 Program and EPA's Sustainability Program.
  • TRI Program Home
  • What is TRI?
    • Covered Chemicals
    • Covered Industry Sectors
  • Reporting for Facilities
    • Guidance (GuideME)
    • Reporting Software (TRI-MEweb)
    • Laws & Regulatory Activities
    • Enforcement
  • Find, Understand & Use TRI
    • TRI Data & Tools
    • TRI National Analysis
    • TRI Pollution Prevention
      • P2 Analyses
      • P2 Resources
    • Data Quality
    • What You Can Do
  • TRI Site Map
Contact Us to ask a question, provide feedback, or report a problem.
Last updated on April 26, 2022
United States Environmental Protection Agency

Discover.

  • Accessibility
  • Budget & Performance
  • Contracting
  • EPA www Web Snapshot
  • Grants
  • No FEAR Act Data
  • Plain Writing
  • Privacy
  • Privacy and Security Notice

Connect.

  • Data.gov
  • Inspector General
  • Jobs
  • Newsroom
  • Open Government
  • Regulations.gov
  • Subscribe
  • USA.gov
  • White House

Ask.

  • Contact EPA
  • EPA Disclaimers
  • Hotlines
  • FOIA Requests
  • Frequent Questions

Follow.