Cheminformatics Modules Manual
Welcome to the User Manual!
The Cheminformatics Modules (CIM) is a set of prototype modules which are using a compilation of information sourced from many sites, databases and sources including U.S. Federal and state sources and international bodies that saves the user time by providing information in one location. The data are not reviewed by USEPA – the user must apply judgment in use of the information. The results do not indicate EPA’s position on the use or regulation of these chemicals.
This guide offers step-by-step instructions to help you access Cheminformatics Modules (CIM) data and features. For additional information or assistance, please contact CCTE@epa.gov.
Navigation
At the top of any page of the Cheminformatics Modules (CIM) is the navigation banner. From here, you can access various modules associated with the application as a whole.

Clicking on each of the individual modules will show the relevant screen associated with that particular module as described below.
- Hazard: Create a hazard comparison profile comparing chemicals across multiple toxicity endpoints.
- Safety: Create a safety comparison profile comparing chemicals across multiple data types including physical properties and safety data including shipping and firefighting.
- Alerts: Profile chemicals relative to multiple structure-based alerts.
- Predict 1.0: Batch prediction of Toxicity Estimation Software Tool (TEST) physicochemical property and toxicity endpoints.
- Predict 2.0: New modeling approaches to property endpoint predictions.
- ToxPrints: Generate ToxPrints and profile chemicals against ToxCast enrichments.
- Utilities: Various tools to harvest data from CommonChemistry and PubChem APIs.
Hazard Module
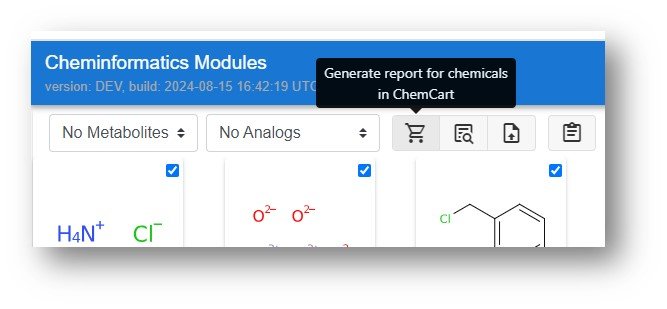
The Hazard Module Navigation Bar is displayed below with highlighted sections as searches to input a collection of chemicals to profile. Various parts of the navigation bar are activated following the entry of chemicals for profiling while the reporting buttons (on the right hand side) are activated following generation on a profile.
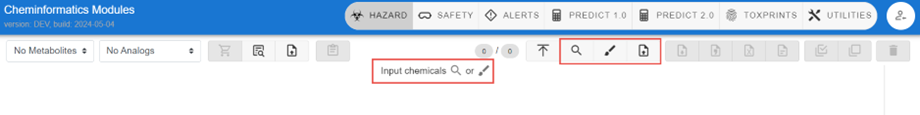
Selecting Chemicals for Profiling
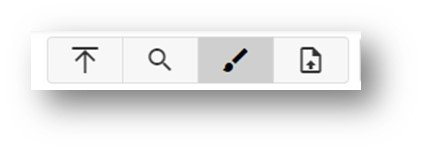
The magnifying glass indicates the ability to search for chemicals while the paint brush indicates the ability to draw a chemical as an input to retrieve a chemical or set of chemicals, while the up arrow allows for upload of a set of chemicals to search
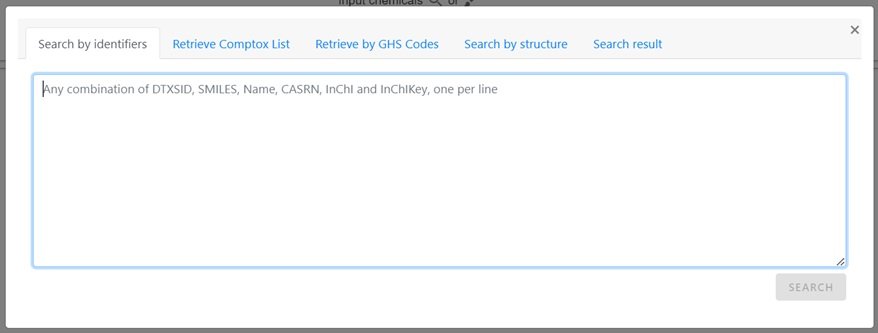
Magnifying Glass – Identifier Search
Selection of the magnifying glass allows for multiple identifiers, either homogeneous in nature or mixed format (i.e., names plus CAS Registry Numbers plus DTXSIDs) to be input to perform a search. The available identifiers supported for searching include SMILES and InChIs as highlighted in the input box shown below.
Following input of a list of identifiers, and selecting the SEARCH button, a set of chemicals will be returned.
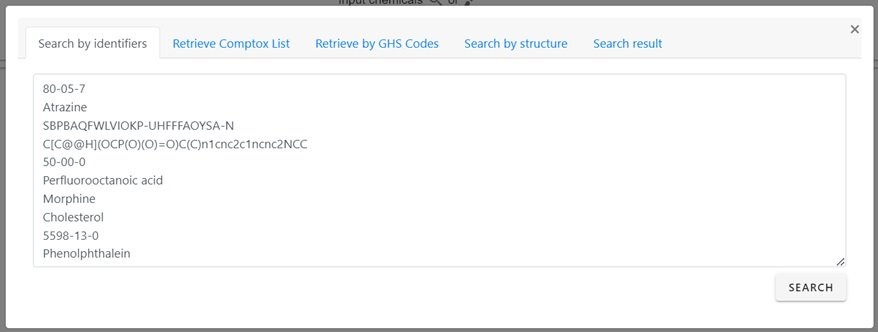
For the 10 input identifiers shown in the input box all retrieve results with the interface reporting that nine are found by searching against the underlying database while one, the SMILES string, is converted into the associated structure. It is possible that not all input strings will return a result, especially in the case of misspellings, absent synonyms in the database etc.
In those cases where the chemicals are retrieved from the database a chemical name and CAS Registry Number (CASRN), where available, will be displayed. From this page it is possible to simply harvest relevant data as downloadable files (highlighted by the red box) in the formats of SDF, CSV, XLSX and SMILES only when navigating left to right. Hovering over any button will display relevant help-text.
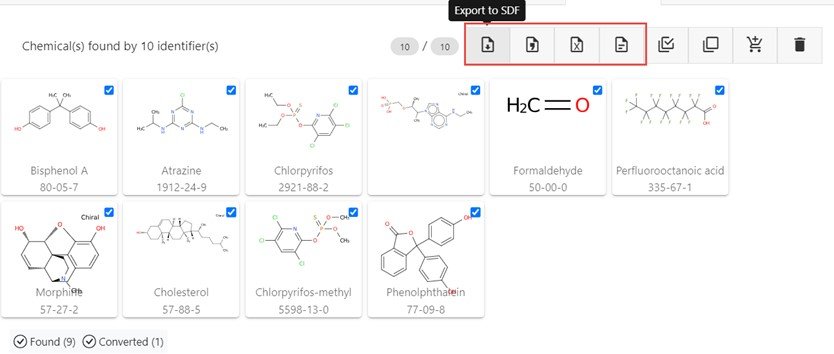
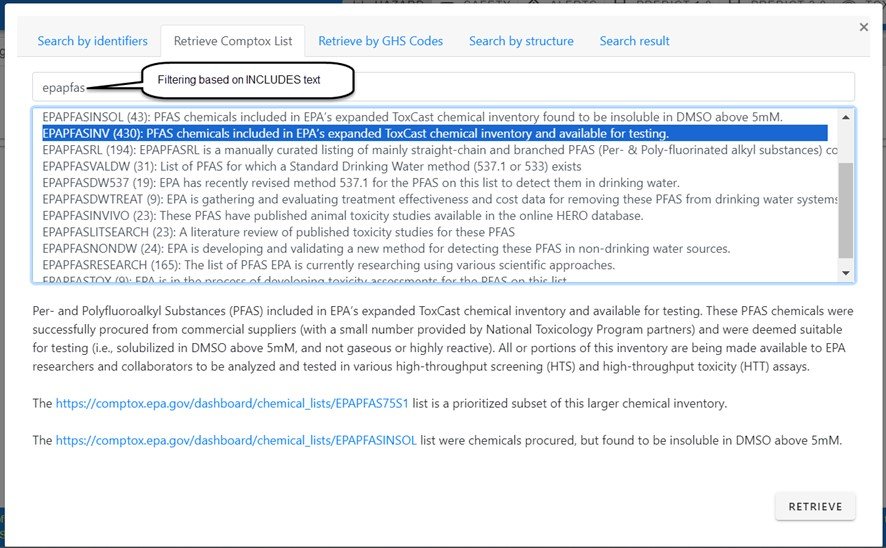
It is also possible to retrieve a list which is already available in the CompTox Chemicals Dashboard. Open the Retrieve Comptox List tab, select the list and click retrieve to load the list for further processing. As an example, in the figure below showing list filtering and selection, the almost 500 CompTox Lists are filtered using “epapfas” as the substring filter, the relevant list is selected (as shown by the highlight) and then retrieved in total.
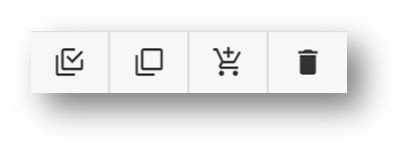
The next operations of interest are the selection of chemicals to include in the Profiling. These are select or deselect all, add to cart for processing, and deletion of all chemicals in the cart.
Paint Brush – Structure/Substructure/Similarity Search
There are two ways to access the structure editor for inputting structures to add to the cart for processing. The first approach is selection from the navigation bar as indicated below, but this only allows for drawing or retrieving one structure at a time to add to the cart for processing.
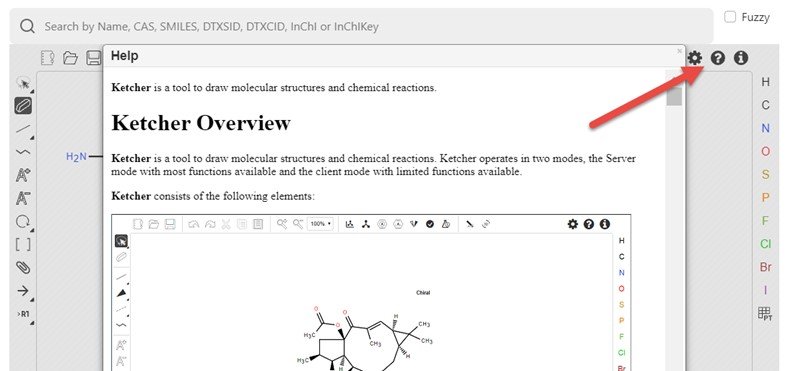
The alternative approach is via the Search by Structure tab which allows for retrieval of a set of chemicals based on a substructure or similarity search. A basic overview of how to draw a structure in the Ketcher drawing editor is available by clicking on the question mark, but more details will be provided in the Search part of this manual.
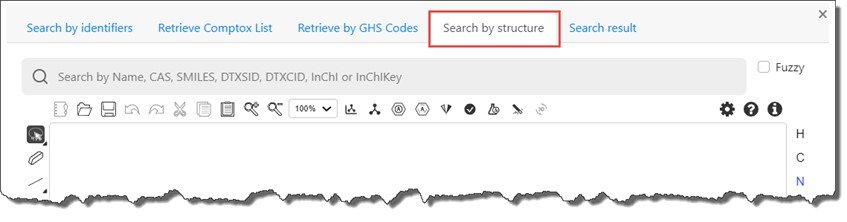
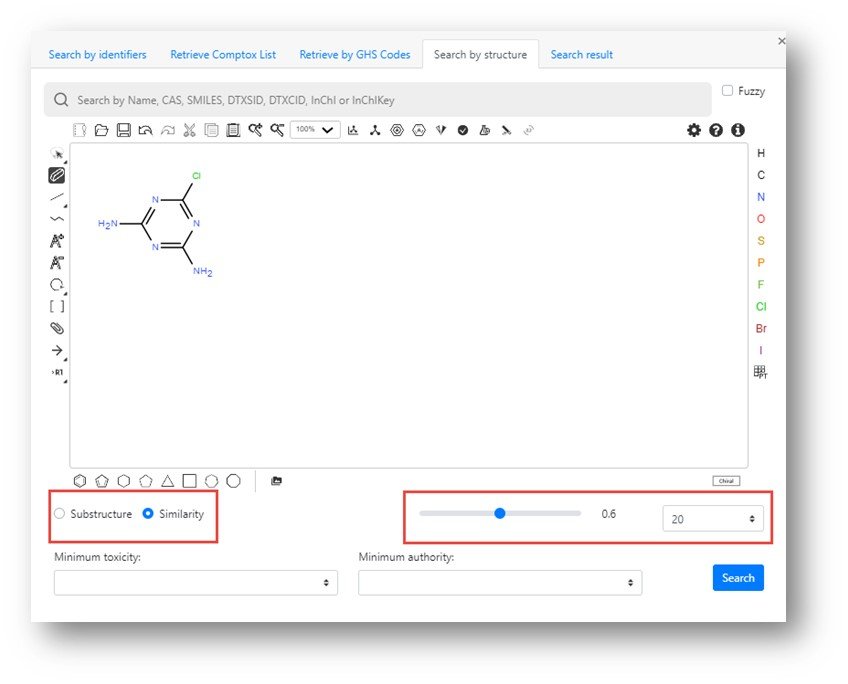
Once a structure is input then a structure or similarity search can be performed (selecting the relevant search on the left hand side) and an appropriate Tanimoto similarity match factor and a maximum number of hits (values set to a match factor of 0.6 and 20 hits in the figure below).
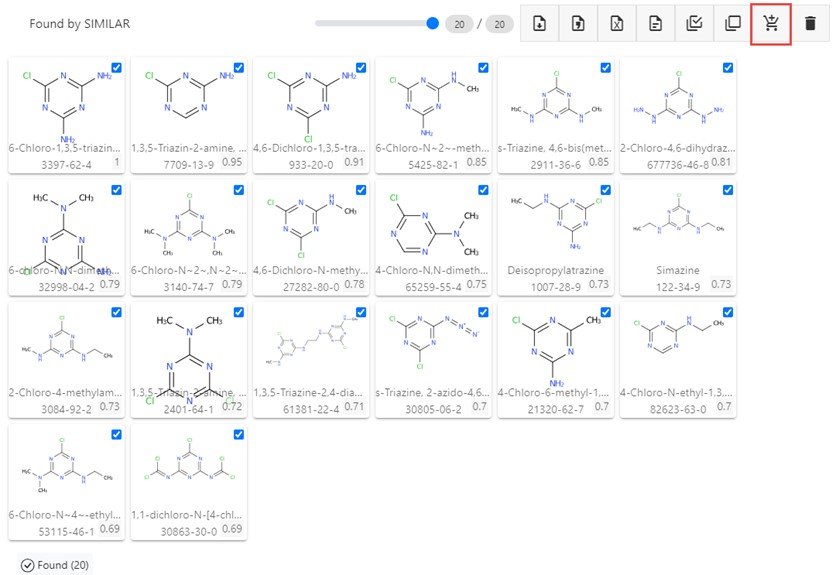
The resulting hit list, as shown below, can be edited using select/deselect of each chemical by clicking on the structure tile, then added to the cart for processing (see the button highlighted by the red box).
Once the chemicals are retrieved and selected for processing then the Hazard Profile can be generated simply by processing the chemicals from the cart.
The Hazard Profile that is generated is a heat map where each cell that has data available is represented by color, a letter, and a font for the letter.
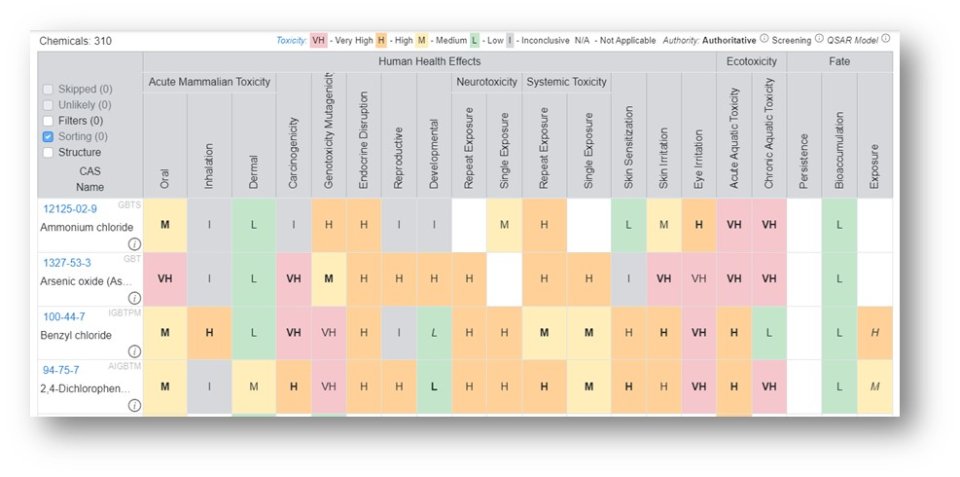
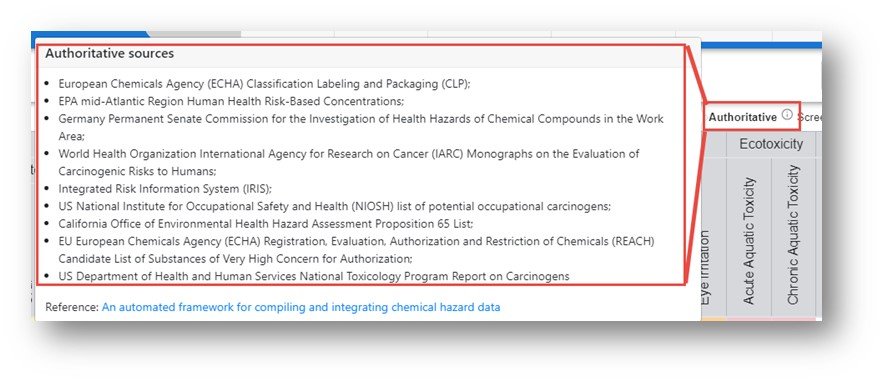
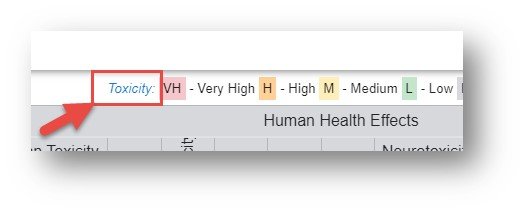
The color-coding and letters on the tiles represent a grade as follows: Red – Very High (VH), Orange – High (H), Yellow – Medium (M), Green – Low (L), Grey – Inconclusive (I) and White – no data available. The color legend is shown at the top of the table. The font associated with the letter on the tile represents the data source authority with three levels available: Authoritative, Screening and QSAR Model. In order to list all sources under the three classes hover over the informational icon adjacent to the words for the sources authoritative, screening and QSAR models. For a detailed breakdown regarding the selection of the sources, access "An automated framework for compiling and integrating chemical hazard data".
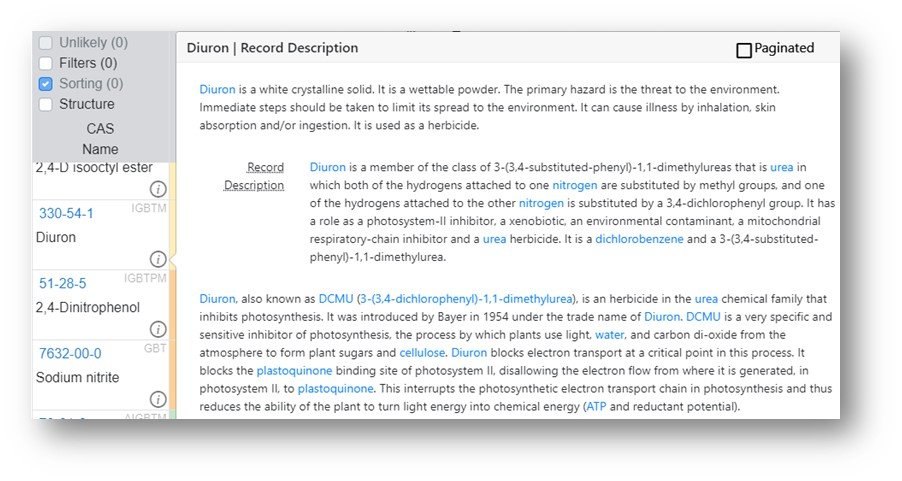
Each of the individual columns can be sorted and the data are displayed in the order of sorting and shown in the interface.
Clicking on a single column (e.g., oral) sorts the column from highest to lowest toxicity endpoint. Clicking on the column again sorts from low to high. The entire set of filters can be cleared using the reset button or removed one at a time by clicking on the “x” adjacent to the sorted column.
Each column represents a specific endpoint and the relative rankings of Very High to Inconclusive are made based on available data sources and a dedicated scoring scheme for each endpoint. In order to review the details for each endpoint hover over the ellipsis icon.
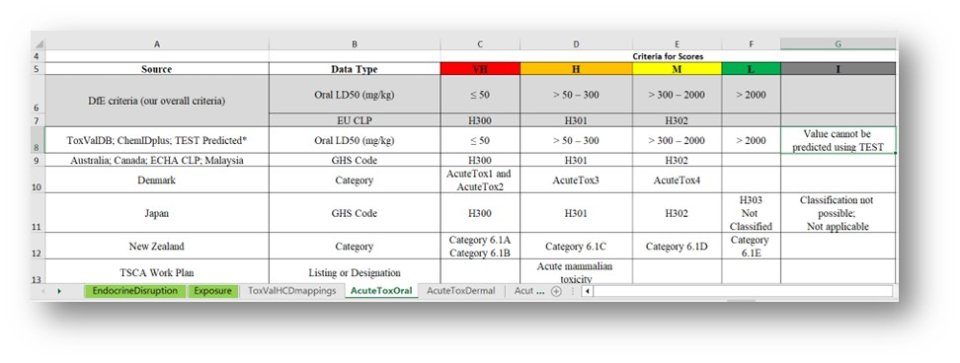
For a list of all scoring schemes downloaded into a multi-worksheet Excel file click on the hyperlinked Toxicity to download the file.
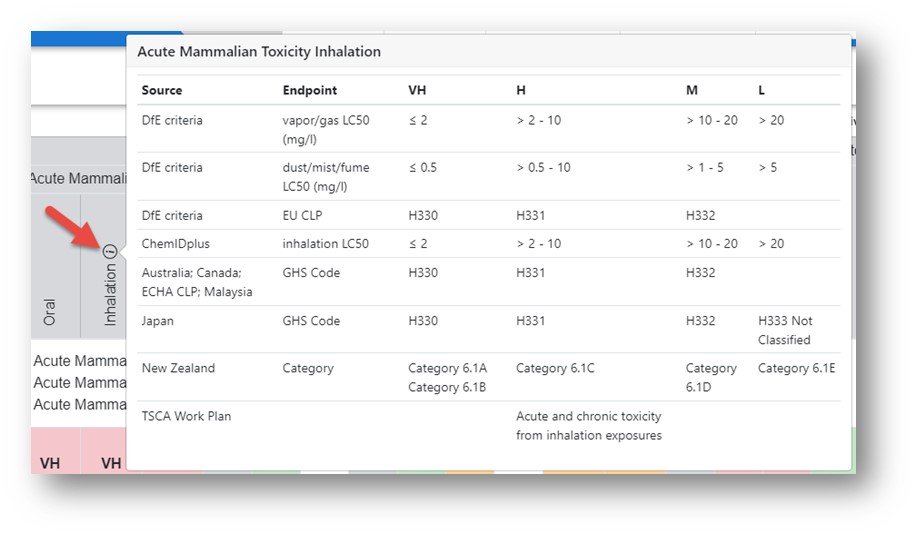
The Excel file contains all relevant scoring details for each endpoint and is a useful reference document.
The Hazard report generated in an particular session can be exported in two formats: 1) as an SDF file which can be opened in cheminformatics software supporting that format or 2) as a multi-worksheet Excel file containing the heat-map display as well as the underlying data in a second worksheet.
The Hazard Profile screen has additional data available for the chemicals displayed in the report. For example, the information icon agent to the chemical name is an on-hover displaying general information about the chemical substance.
In addition to the basic information about the chemicals additional information, specifically links to other sites, are available by clicking on the array of letters adjacent to the CAS registry number.
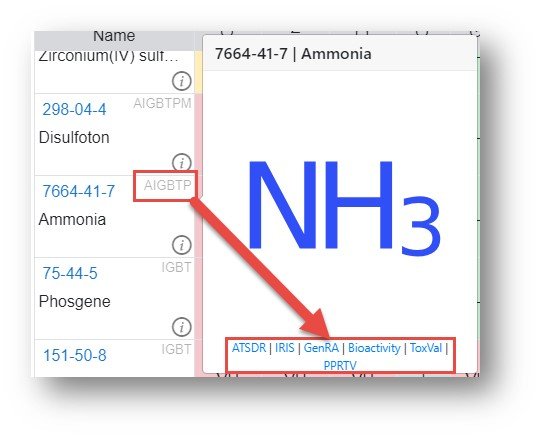
Each of the hyperlinks underneath the structure image is an active hyperlink to the relevant data source:
- A – ATSDR: Agency for Toxic Substances and Disease Registry tox profiles
- B – Bioactivity: ToxCast/Tox21 in the CompTox Chemicals Dashboard (CCD)
- G – GenRA: Run Generalized Read-Across on the chemical in the GenRA app
- I – IRIS: EPA Integrated Risk Information System risk assessments
- P – PPRTV: Provisional Peer Reviewed Toxicity Value reports
- T – ToxVal: View data associated with the ToxVal data in CCD
The substance information informational icon and the external hyperlinks discussed above are also available in the Safety module.
Hazard Use Cases
Using the features outlined above, a number of use cases will be outlined below.
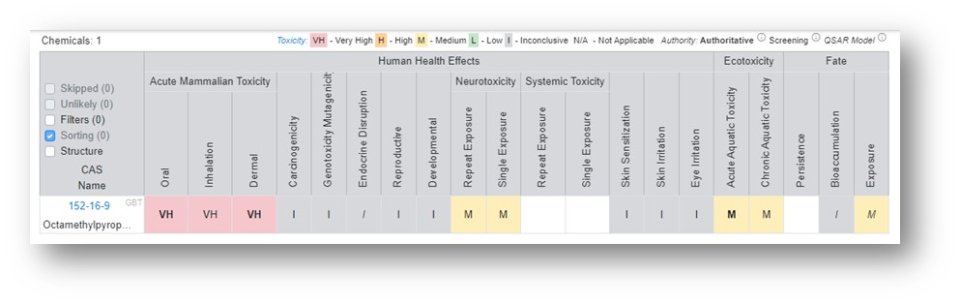
Retrieval of Single Chemical Data
Retrieval of data associated with a known chemical of interest, registered in the DSSTox Database, and general of display of results and download
This simple workflow simply requires inputting the relevant identifier (CASRN or name), searching the DSSTox database, and generation of the Hazard profile then download.
- Input the identifier into the search box or draw the structure in the structure drawing box to ensure the chemical is in the database
- Generate the Hazard Profile
- Download the relevant file format to the desktop, with XLSX being the generally preferred format
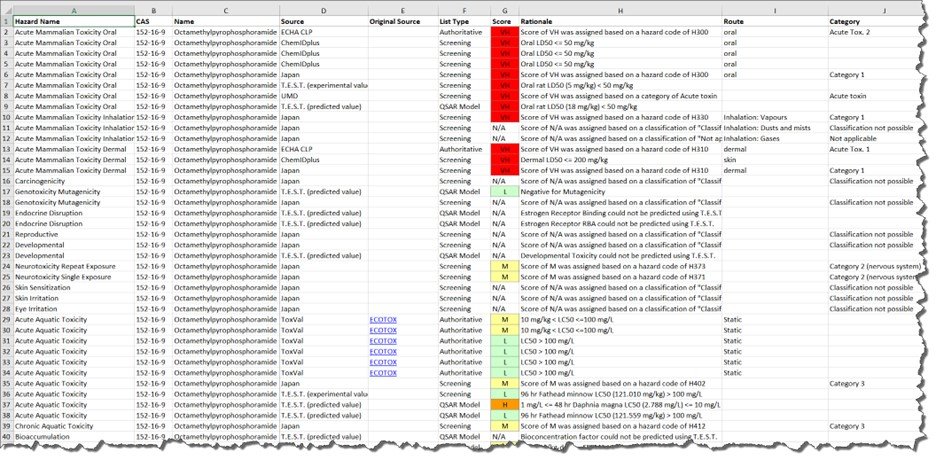
Example chemical: Octamethylpyrophosphoramide, CASRN: 152-16-9
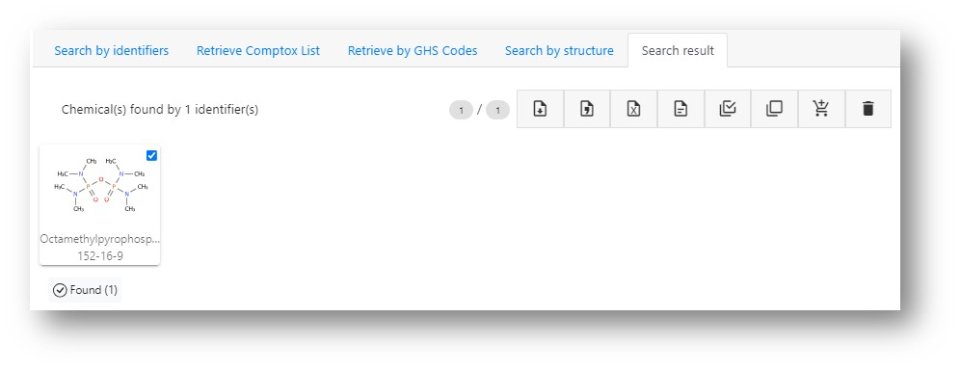
Generate the relevant Hazard Profile

Export the Report
- Retrieval of Analogues Based on Similarity
This simple workflow retrieves data following input of a chemical structure of interest, performing a search based on chemical similarity, and profiling the related chemicals of interest.
- Draw the chemical to be searched based on similarity or retrieve from DSSTox
- Set the threshold for similarity searching and retrieve the hits
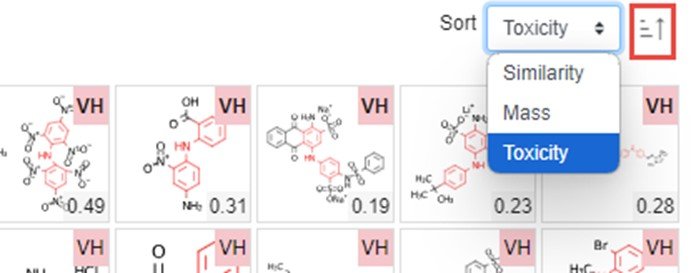
- The hit list resulting from a similarity search is paginated and the number of hits on a page can be adjusted (bottom left-hand corner of figure). The hits can be sorted based on similarity, mass or toxicity (top right-hand corner of figure). Send a single page of hits to the Hazard Comparison Module (HCD) or other modules as appropriate.
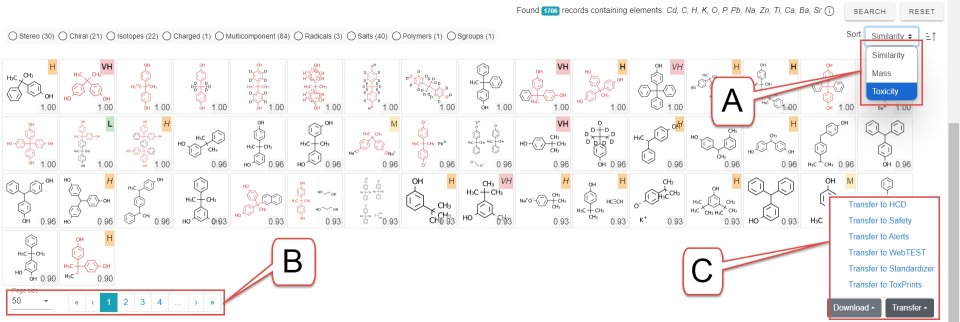
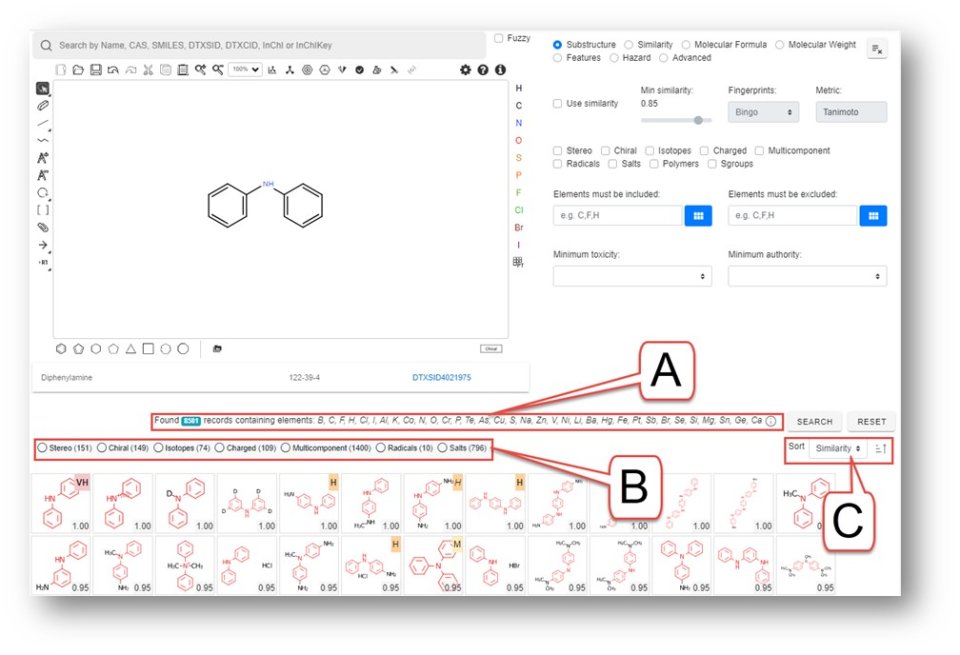
- A: Sort records by similarity (default), mass of toxicity. Generally choose toxicity sorting before sending chemicals to the Hazard module
- B: Select number of chemicals on a page and shuttle between pages
- C: Choose module to transfer a page of chemicals to the cart for further processing
Safety Module
The safety module delivers access to data that would be of primary value to emergency responders as it provides access to data such as ignitability, reactivity, personal protection equipment, GHS data and an abundance of other safety data. The data have primarily been harvested from PubChem for chemicals contained within the DSSTox database, integrated with additional data from that database, and delivered via the user interface in the Safety Module.
Safety data can be generated using a similar workflow to that used to generate a Hazard comparison profile. First of all one or more chemicals must be added to the cart for processing by inputting the necessary identifiers to retrieve from the database and running the safety profile. Following the steps outlined in the Hazard module to retrieve the chemicals of interest and then generate the safety profile.
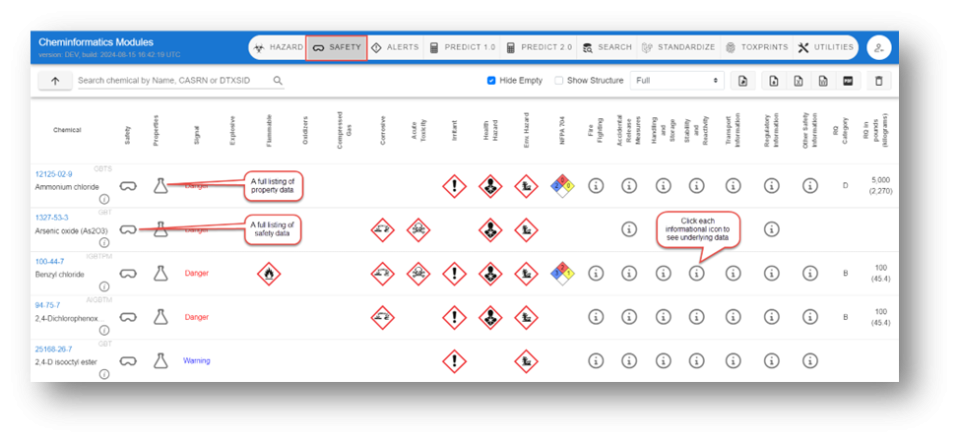
- A. A full listing of property data
- B. A full listing of safety data
- C. Click each informational icon to see underlying data
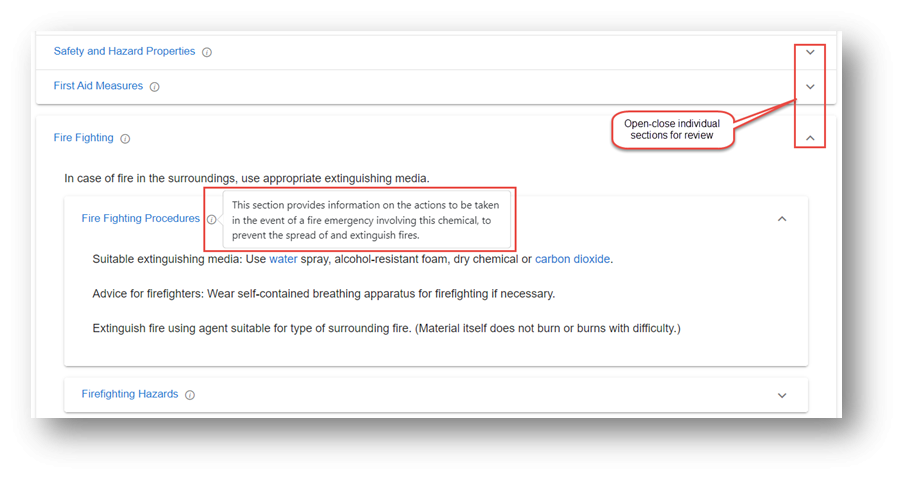
Each chemical has multiple icons associated with, from left to right, the overall safety data (safety glasses icon), all property data (the conical flask icon), relevant GHS icons, a National Fire Protection Association icon, and a number of information icons associated with other safety data types. Navigating into the underlying data includes hovering over the informational icons and using the arrows to open/close different sections.
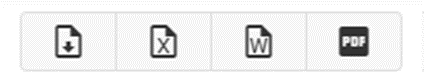
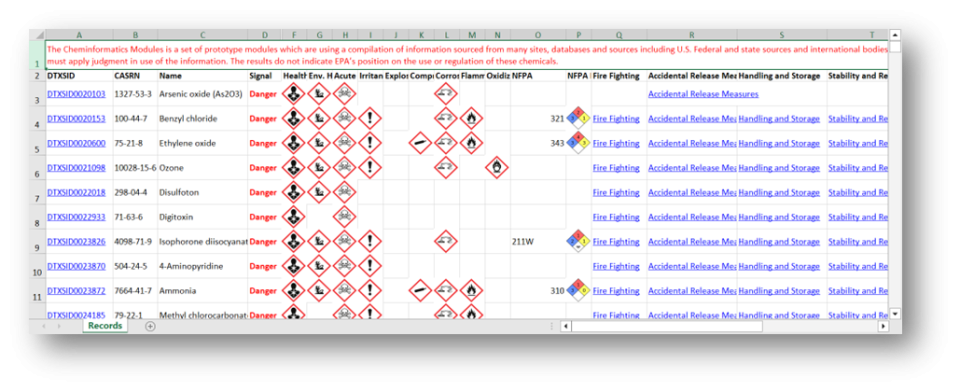
A report from the Safety Module can be generated in four formats: SDF, Excel, Word or PDF. The Excel format includes basic chemical details, GHS pictograms and hyperlinks to the various types of available data.
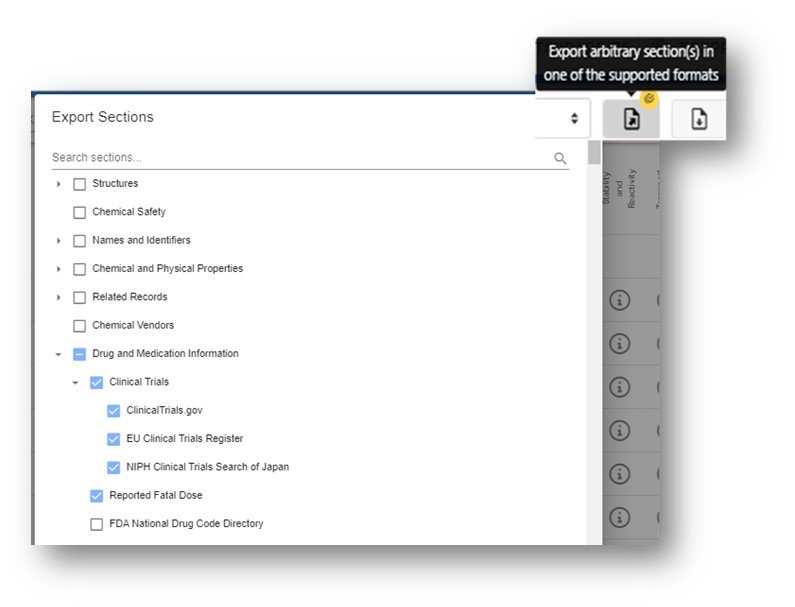
The Safety Module offers the ability to export specific sections of the safety data by selecting the “Export Arbitrary Section…” button and selecting the sections to Export. When the sections are selected scroll to bottom and choose the format for export.
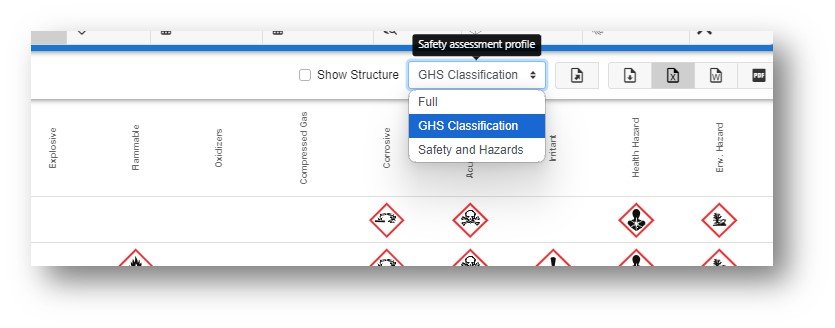
The default display for the safety profile is “Full” but two other filtered views can be chosen: GHS Classification and Safety and Hazards. Selecting either profile will switch to the relevant filtered set for display.
Search Module
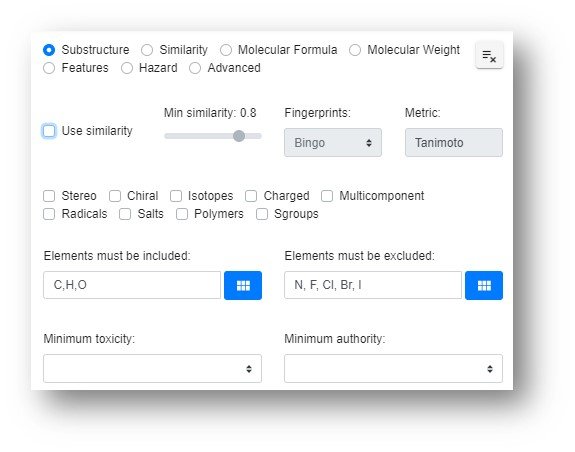
The Search Module is primarily a structure-based search that can be the start point to lead into the majority of other modules and offers a lot of flexibility in terms of hit list filtering prior to transferring the hit list into other modules. The list of potential searches and their related filters are shown below.
Each of these searches will be discussed with many of the aspects of the functionality carrying between individual search types. Firstly we will start with the basics of the drawing editor.
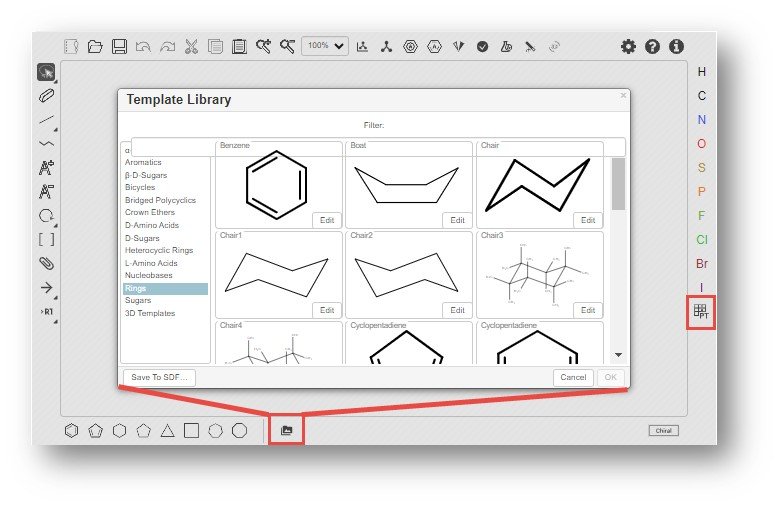
A chemical can be drawn in the Ketcher editor by choosing from the default rings, chemicals from the template library or selecting from the periodic table and bond types. Learn more about Ketcher here.
Users are encouraged to review the Ketcher webpage linked above for details regarding how to draw a structure.
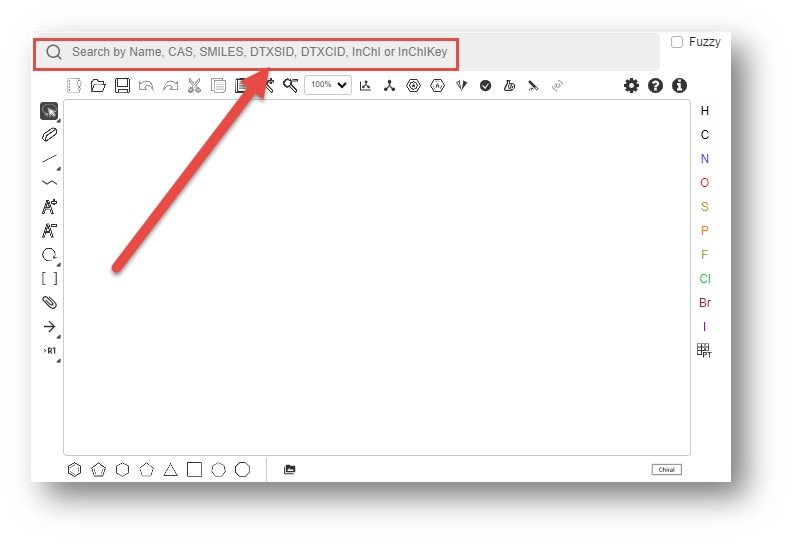
Above the structure drawing editor is an input box to search for chemicals based on input names, CAS RN, SMILES, DTXSID, InChIKeys and other identifiers. If a structure is returned to the drawing palette then it can be edited and used for further studies including similarity and substructure searches. Chemicals can also be added to the editor by copy-pasting of SMILES and molfiles through the clipboard.
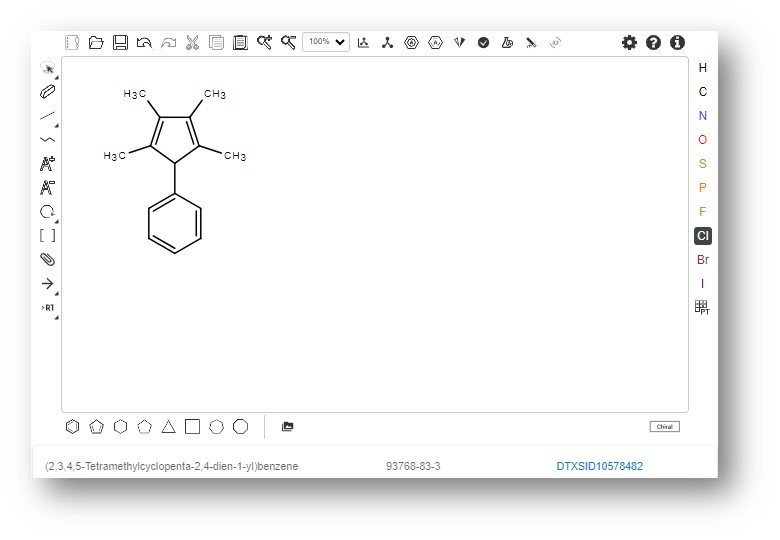
Drawing a structure in Ketcher performs a realtime search against the underlying database of 1.2 million substances. The resulting search displays the hyperlinked DTXSID linked to the CompTox Chemicals Dashboard as shown in the figure below.
Substructure Searching
When a substructure is input and the search performed the hit is returned and can be filtered. In the example shown below a substructure search was performed on diphenylamine (shown in the drawing editor). The resulting hit list of ~8600 chemicals contains a long list of other elements (indicated by callout bubble A in the figure) that can be useful as a basis to exclude from the hit list (described below).
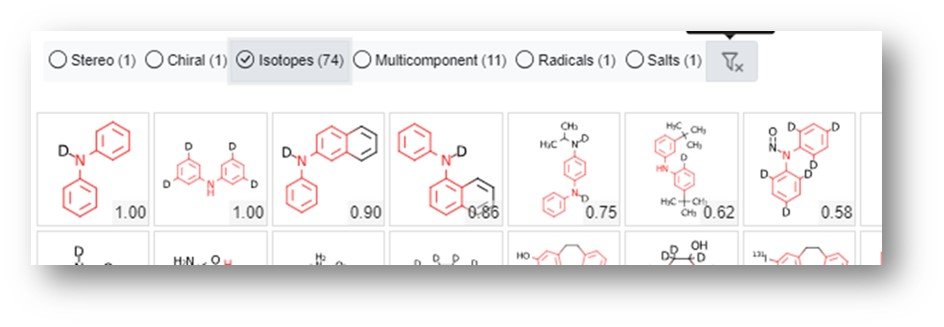
The filters indicated by callout bubble B above are “three-state” filters – one click filters the selection out (indicated by an x), a second click filters the selection in (indicated by a checkmark) and a third click switches the filter off. This is exemplified by selecting only the isotopes as shown below.
The filters indicated by callout bubble B above are “three-state” filters – one click filters the selection out (indicated by an x), a second click filters the selection in (indicated by a checkmark) and a third click switches the filter off. This is exemplified by selecting only the isotopes as shown below.
The sorting functionality indicated by the callout bubble C allows for the hit list to be sorted my similarity, by toxicity or by mass. Sorting by toxicity brings those chemicals with tox data to the top of the list while the ranking sort, highlighted in the red box reverses the search.