
GenRA Manual: Analogue Identification
- Choosing similarity context
- Interpreting the source analogue outcomes
- Physicochemical similarity
- Immediate neighborhood exploration
Analogue Identification
Choosing Similarity Context
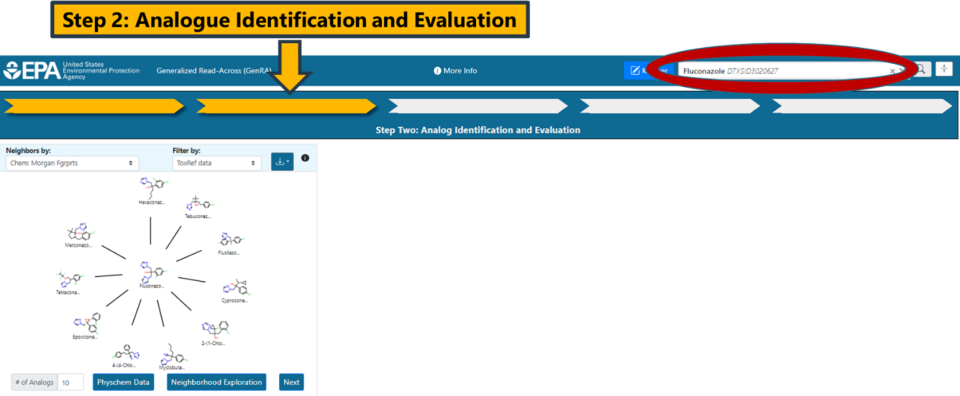
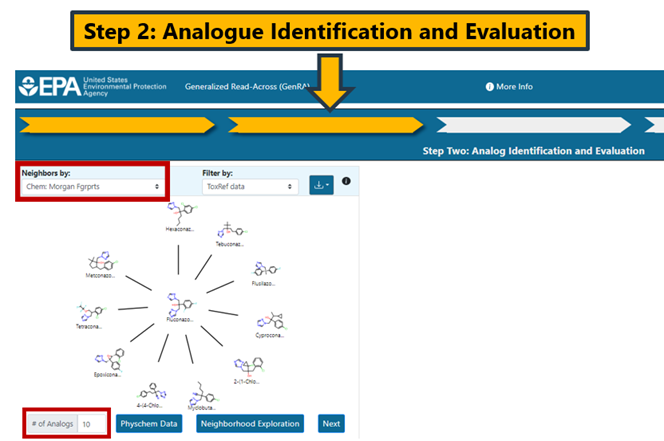
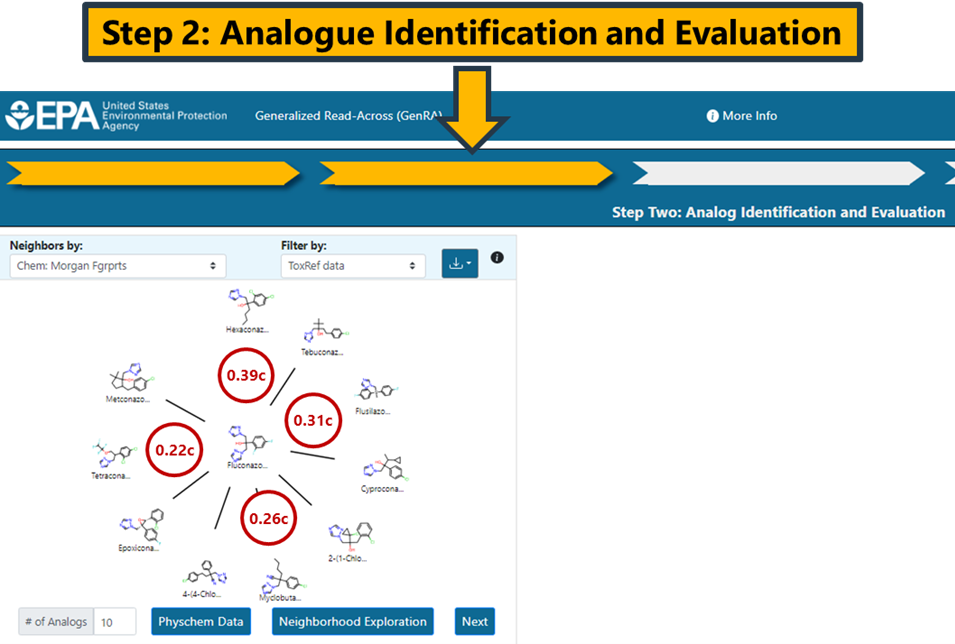
This step involves identifying source analogues based on different similarity contexts. The main contexts are structure and bioactivity using a range of different fingerprints. By default, Morgan chemical fingerprints (Chem: Morgan Fgrprts) are used as the structural basis (Figure 9).
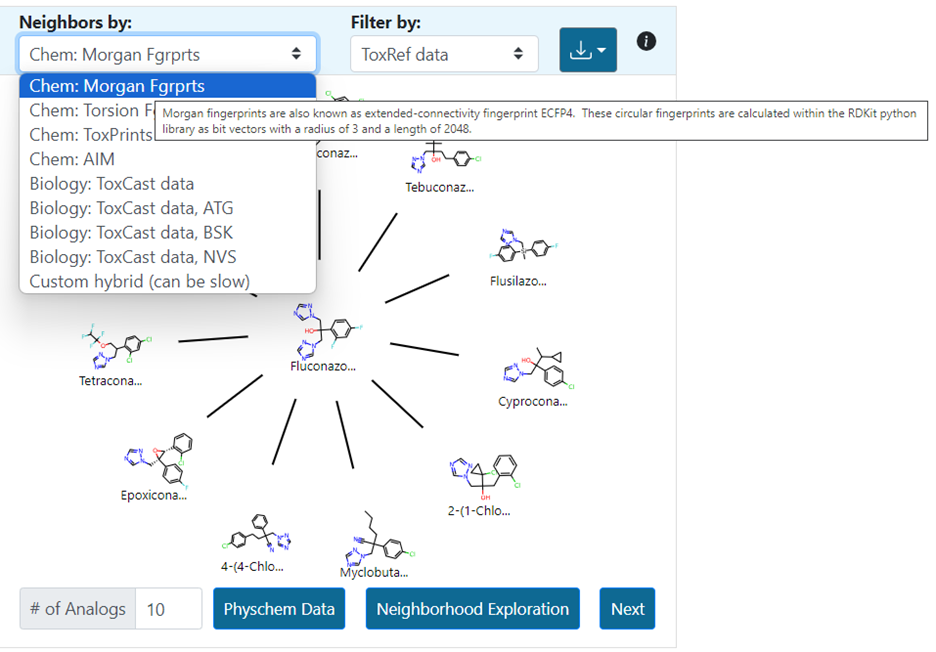
Other chemical fingerprints include torsion fingerprints (Chem: Torsion Fgrprts), Tox Prints (Yang et al., 2015), AIM (Adams et al., 2023) as well as bioactivity descriptors (Biology:ToxCast). There is a drop-down menu for each fingerprint and hovering over each selection provides additional information about the fingerprint type (Figure 10).
A custom fingerprint option provides the ability to search for analogues on the basis of up to 3 pre-existing fingerprints. The user can adjust the weightings to their desire relative contributions using a slider (Figure 11). Selecting submit will update the radial plot with the 10 nearest source analogues based on the defined custom fingerprint.

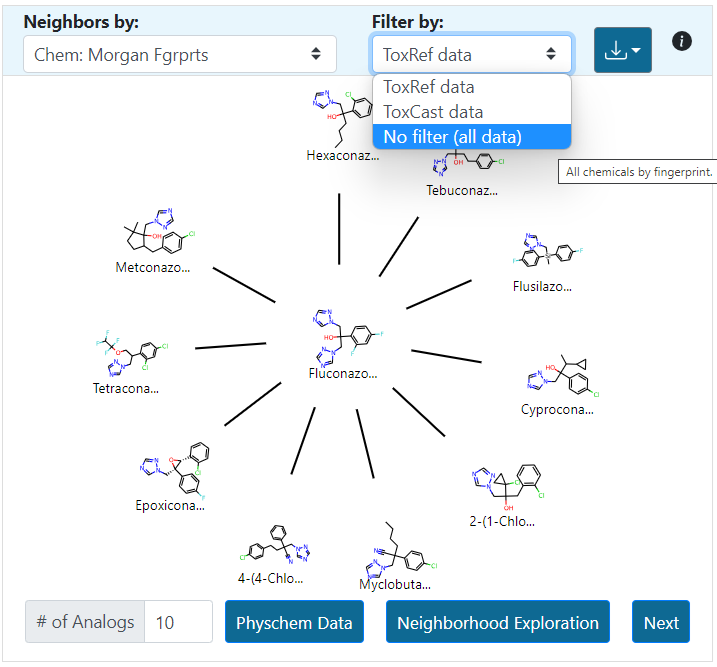
The number of source analogues that can be returned ranges from 1 to a maximum number of 15. Analogues are automatically filtered on the basis of in vivo toxicity data to facilitate subsequent read-across predictions. However, the user can update the view to show the most similar filtered by availability of ToxCast data or remove the filter completely by selecting the “No filter” option (Figure 12). The “i” icon provides additional support and information about operating Panel 1. These help icons are replicated in all the other panels in the interface.
Interpreting the Source Analogue Outcomes
The radial plot depicts the source analogues in decreasing order of similarity using the Jaccard similarity metric. The Jaccard metric varies between 0 and 1 where 1 denotes complete similarity. No minimum threshold exists for how similar an analogue needs to be for inclusion in the analysis. The similarity metrics will differ depending on the fingerprint type selected. Hovering over any of the analogues in the plot will show the similarity index and its type. The subscript c denotes that the Jaccard similarity is identified using chemical features. The subscript b is used for bioactivity descriptors, and x is used for custom descriptors. In the example using Morgan fingerprints, the pairwise similarity between Hexaconazole and Fluconazole is 0.39 whereas the pairwise similarity for Fluconazole and Flusilazole is 0.31 (Figure 13).
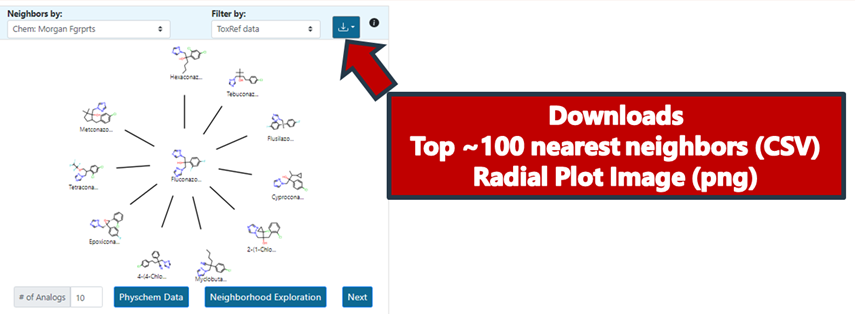
It is possible to download the radial plot view as an image as well as the top 100 most similar analogues as a CSV file (Figure 14). This is particularly useful should a user wish to do any post-processing, identify additional data using CCD, or profile using functionalities available in the Cheminformatics modules. The top 100 analogues download provides a list of SMILES, DTXSID identifiers, the pairwise similarities relative to the target substance as well as the actual fingerprints themselves.
Note: Clicking on a different source analogue represented in the radial plot will open a new browser tab showing the chemical landing page of the analogue from CCD.
Preliminary Analogue Evaluation
Physicochemical similarity
Clicking on Physchem Data in panel 1 will open a set of distribution plots for selected physicochemical properties (Figure 15). The physicochemical properties are molecular weight, melting point, boiling point, LogP (octanol–water) partition coefficient, vapor pressure, water solubility and Henry’s Law constant. The values plotted are stored predictions that have been derived using the OPERA suite of models. This physicochemical data explorer presents the distribution of different predicted properties as a series of boxplots overlaid with swarm plots. The view can be resized using the right hand bottom corner of the pop up window. Legends on the right-hand side of the panel list the target chemical and its analogues in decreasing order of similarity. The analogues can be toggled between hidden and shown by clicking on the legend entries on the right-hand side. Double clicking an analogue isolates the given analogue, hiding all other results. The plot is interactive so that hovering over any of the data points will show the exact value for a given property and the associated chemical name (e.g. the melting point of Tebuconazole is 102.495°C).

The physicochemical distribution provides a perspective on how comparable the properties are across the source analogues relative to the target substance. The properties are also tabulated in the data matrix view in panel 4.
Immediate neighborhood exploration
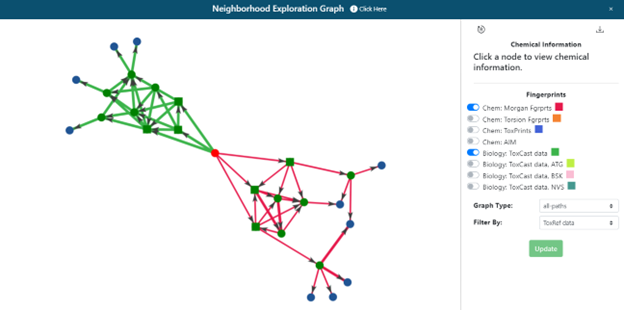
Clicking on ‘Neighborhood Exploration’ on the radial plot will open the neighborhood exploration tool (Figure 16). This shows:
- The immediate landscape surrounding the target substance, its first 3 source analogues and their neighbours to provide some context of the chemical landscape.
- The overlap and commonality of the top 3 analogues using different fingerprints and their next-generation analogues. This starts to answer the question, “Are the same analogues identified by different fingerprint representations?”.
The default network presented is of the 3 most similar analogues based on ToxCast (green) and Morgan Fingerprint (red) fingerprints with the same filter selected in panel 1 (Figure 16). Different filter and fingerprint (FP) selections can be made within the popup window and the view refreshed by clicking on the update button.
The network depicted can be zoomed in/out to aid viewing or exported as a JSON download for data analysis in other 3rd party tools. The network is a collection of nodes (the target, its source analogues, and their neighbors) with the connections or edges between them representing their pairwise similarities. The edge thickness correspond to higher pairwise similarities. Nodes (chemicals) can be moved on the interactive panel to aid exploration. A reset button at the top left of the control panel will return the view to the last original state in an effort to ‘clean’ the depiction. Clicking on any node will recenter the graph and present the user with additional information for that specific substance including its chemical identifiers and 2D structural depiction. Hovering over the source analogues in the graph will show the DTXSID identifier and chemical name. Clicking on a node within the network will also provide the option to re-start the GenRA workflow with that substance by clicking on the green GenRA button. Note that selecting the green GenRA button here will supersede the present workflow and reset all other options to their defaults.
The neighborhood exploration tool provides a complementary means to explore the source analogues returned from different FPs. Once the user is satisfied with the analogue selection, clicking on the “Next” button in panel 1 will proceed to the next step of the workflow and panels 2 and 3 will become populated.
Next chapter: Data Gap Analysis