Chemicals Dashboard Help: Basic Search
There are a variety of search capabilities presently available on the dashboard. The basic search can be performed on the homepage by chemical name or identifier, product use category, and assay/gene name. A number of chemical "identifiers" can be searched including chemical name, common name, CAS Number or InChIKey. The search is set up as an EXACT String Search by default (giving a single result) but selecting the Identifier substring search box allows for a larger results set. The results can also be pre-filtered using the checkboxes below the entry box to return only chemical entities that have a single component or exclude isotopically-labeled compounds (e.g. no deuterium- or 13C-labeled compounds).
For all searches, both homepage and in-Dashboard search box, after a brief delay a drop down list of possible matches appears. The mouse or arrow keys + Enter can be used to select preferred choice. A successful chemical search opens the Details page for that chemical, product use and assay / gene searches yield tables of relevant information.
- Chemical Details
- Executive Summary
- Physchem Properties
- Environmental Fate/Transport
- Hazard
- Safety
- ADME>IVIVE
- Exposure
- Bioactivity
- GenRA
- Literature
- Links
- Comments
Chemical Details
Details
The Details tab provides overview information for the selected substance, including different identifiers, relationships to other substances, QA/QC and other metadata, and a description from Wikipedia, if available. By default, the Wikipedia and Intrinsic Properties sections of the “accordion”, if present, are expanded and the other sections are collapsed, clicking a section heading expands or collapses the section.
Here is an example of the returned result when "BPA" is searched: Bisphenol A Chemical Result
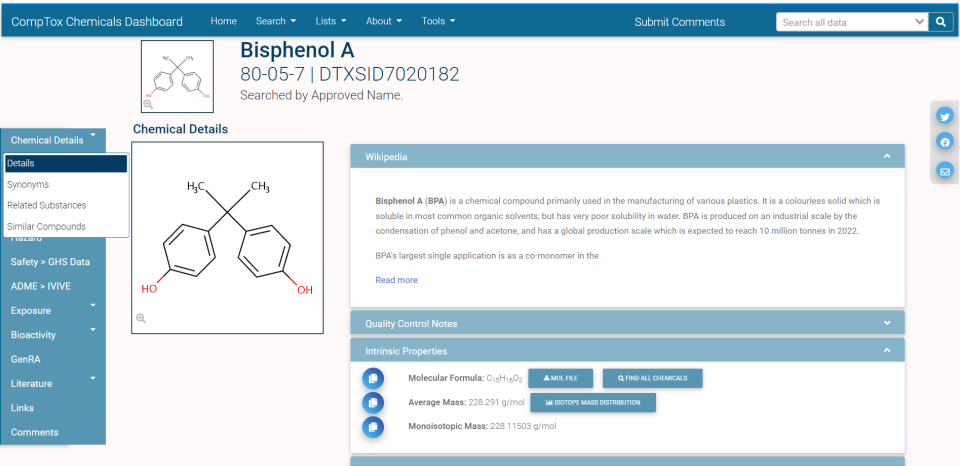
Details tab.
Wikipedia
The Wikipedia section contains a short description of the chemical from its Wikipedia page. Selecting the Read More link on that section opens to the Wikipedia page for the chemical.
Quality Control Notes
The Quality Control Notes section provides information on quality control information for the chemical where applicable.
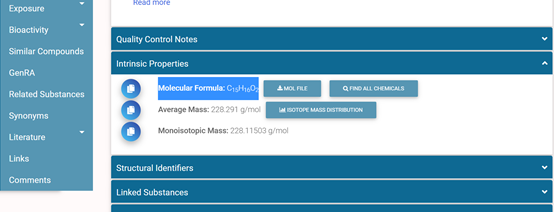
Intrinsic Properties
For chemicals with a defined structure, the Intrinsic Properties section displays the Molecular Formula, the Average Mass, and the Monoisotopic Mass. The molecular formula component displays the formula for the chemical (e.g. C15H16O2). There is a link for a downloadable Mol file allowing you to load the molecules structure into other software. The Find All Chemicals button provides a table of all chemical substances with the same molecular formula which can be downloaded. The Average Mass component provides the average mass of the chemical in grams per mole. The Isotope Mass Distribution button provides a display of the relative abundance of the isotopes of the chemical along with the mass-to-charge ratio. The Monoisotopic Mass simply displays that value for the chemical.
Structural Identifiers
Various identifiers for the chemical, including:
- IUPAC name
- SMILES structure – note that this is a substance level SMILE structure. This SMILE structure and two others (Mass Spectrometry (MS) ready SMILES, and QSAR ready SMILES (e.g., those used to run OPERA models)) can be downloaded using the batch download
- Full InChI string
- InChIKey (for searching on-line).
There are also links to open a Google search page for the structural skeleton (first part of the InChIKey, or the full structure (full InChIKey).
Linked Substances
The Linked Substances section contains links to tables of related chemicals:
- Same Connectivity - the structural skeleton according to the first part of the InChIKey.
- Mixtures, Components, and Isotopomers - links to other chemicals containing the selected chemical, or in the case of multi-component chemicals (e.g. Perisoxal citrate), other chemicals containing each component, as well as isotopomers.
- Similar compounds - a link to similar compounds based on a calculated similarity value, see Similar Compounds for details. This is the same list as the similar compounds tab on the left.
Presence In Lists
The Dashboard includes a database of curated lists of chemicals, this section provides links to lists containing the selected chemical, in Federal, US State, International, and Other categories.
Record Information
The Record Information section contains a citation (with copy-to-clipboard button) that can be used to cite the selected chemical’s page in the Dashboard. It also reports the data quality level for the selected chemical’s data in the Dashboard, with levels from highest to lowest:
- Expert curated, highest confidence in accuracy and consistency of unique chemical identifiers
- Expert curated, unique chemical identifiers using multiple sources
- Programmatically curated from high quality EPA source, unique chemical identifiers have no conflicts in ChemID and PubChem
- Programmatically curated from ChemID, unique chemical identifiers have no conflicts in PubChem
- Programmatically curated from ACToR or PubChem, unique chemical identifiers with low confidence, single public source
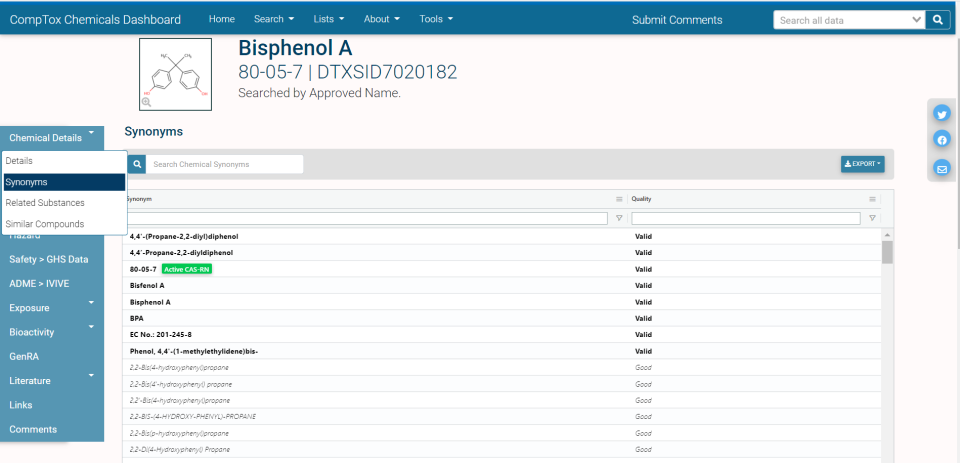
Synonyms
The Synonyms tab provides a curated list of Synonyms with their associated quality (valid, good, other, deleted).
The database contains over a million synonyms obtained from various resources. These are displayed with the relevant quality flags as shown below. Valid Synonyms are those that have been manually curated by members of our curation team. Good Synonyms have been obtained from a variety of sources and using complex workflows for cross-referencing are ranked as being of higher quality than the remaining collection of “Other Synonyms”. The synonyms are not warranted as perfect or complete but are the results of our best efforts.
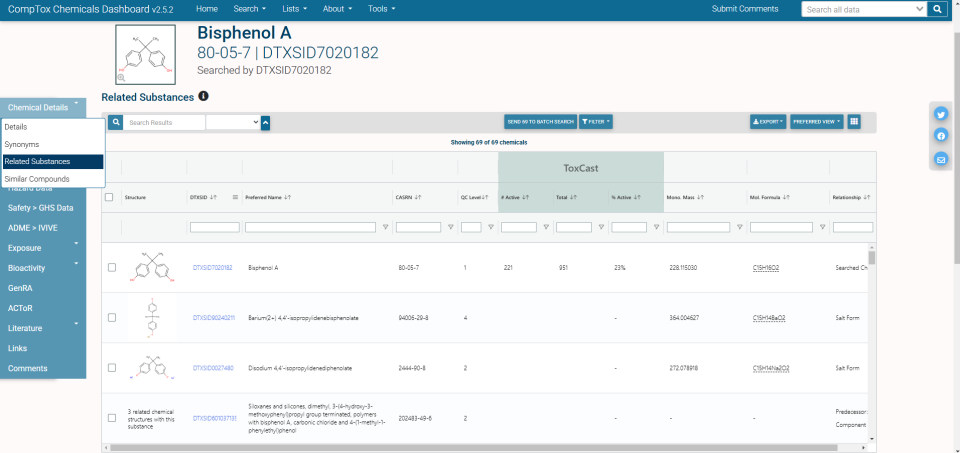
Related Substances
The Related Substances tab provides a chemical list of all chemicals related to the selected chemical.
Relationships include:
- Searched Chemical (self relationship)
- Salt Form
- Monomer
- Polymer
- Predecessor: Component
- Component
- Markush Parent
- Markush Child
- Transformation Parent
- Transformation Product
Note: The Relationship column in tabular view defaults to the far right of the table, the table view may need to be adjusted horizontally to make it visible. Related substance results always include the target chemical as the first result in the table.
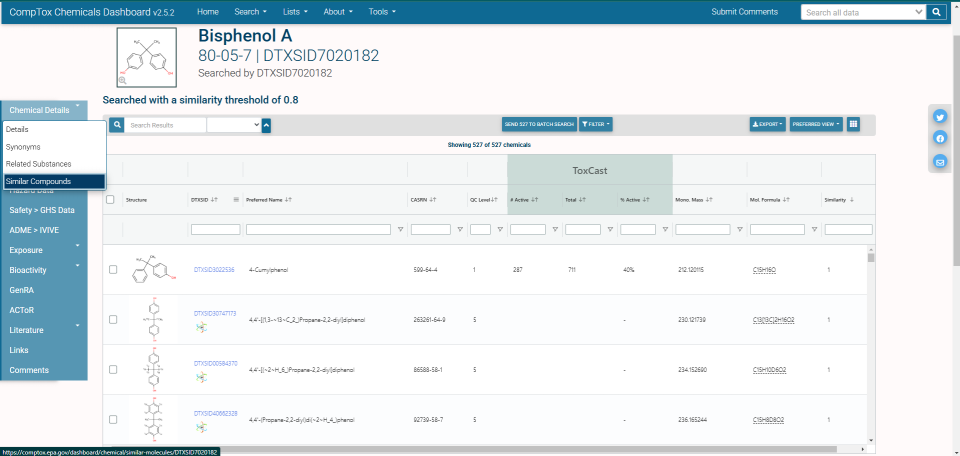
Similar Compounds
The Similar Compounds tab provides a list of chemicals that are similar in structure to the selected chemical, and is based on the Tanimoto similarity search metric with a minimum similarity factor threshold of 0.8. Since the chemicals set is displayed in the usual Table format utilized across the rest of the application the chemicals set can be toggled between table and structure tile mode and, for the case of similarity searches, sorted based on increasing and decreasing similarity score. The resulting set of chemicals can be downloaded in various formats including Excel, comma-separated values (CSV) and SDF formats (generally readable by chemoinformatics tools such as ChemDraw, ACD/ChemSketch and others). The hit list can be filtered in the same way as all other chemical results in terms of filtering out isotopically labeled chemicals, multiple component substances etc.
A chemical can match multiple chemicals with a similarity search match factor of >0.8, for example, see Bisphenol A similarity matches which has over 400 chemicals above that threshold. It is possible to have multiple chemicals with a match factor of 1.0, which might be assumed to be a perfect match but is, rather, an indication of the match of the structure bitstring fingerprint.
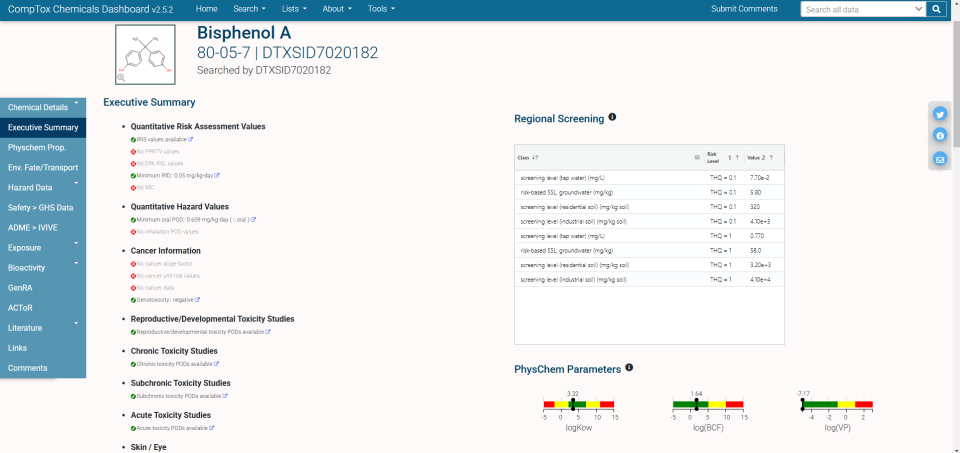
Executive Summary
The Executive Summary tab summarizes the selected chemical’s characteristics and data availability for the selected chemical. Red cross marks and faded text indicate an absence of data. Green check marks and normal text indicate the presence of data. Data summarized includes toxicology, behavior in the environment, safety, carcinogenicity, and Adverse Outcome Pathway (AOP) information.
Some links, like the AOP data, go to external resources, but many, so called “deep links”, guide the user deeper into the Dashboard data itself. Deep links take the user to the Dashboard page where the information referenced in the Executive Summary can be found in detail.
The Executive Summary tab also includes plots of some of the selected chemical’s physical parameters, Point of Departure (POD) ranges for bioassay endpoints, and a summary of TOXCAST data. There is a also a table of “regional screening” levels, levels considered protective of public health in environmental exposure scenarios.
Physchem Properties
The Properties tab provides values for various properties of the selected chemical, like Boiling Point, Index of Refraction, Density, etc. Both experimental (measured in a laboratory) and predicted (by mathematical / computer models) values are available.
Navigating Physchem. Properties Tab
By default, the Properties tab shows a Summary category which combines Experimental and Predicted values for over a dozen different chemical properties.
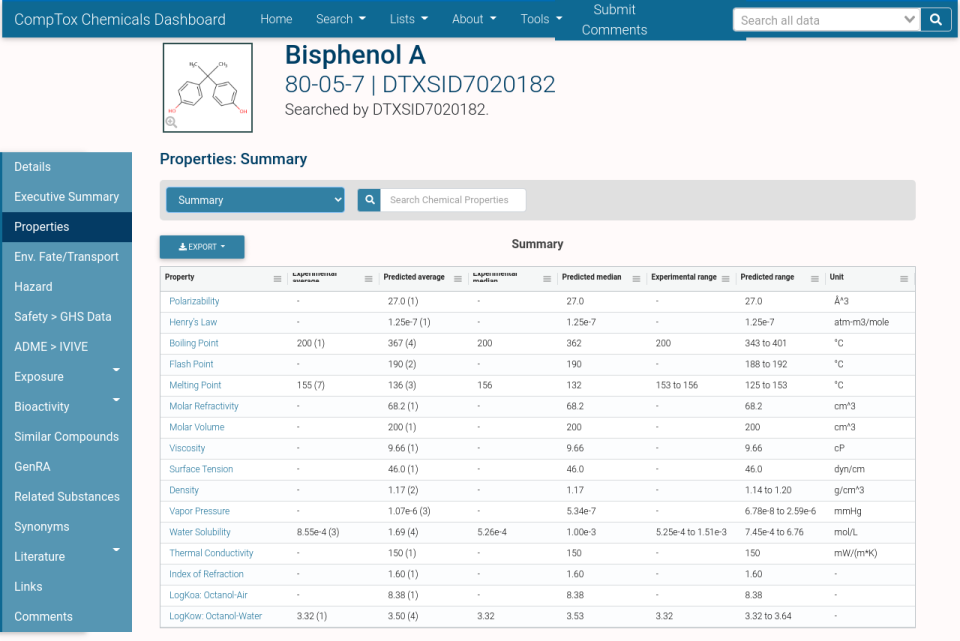
You can click on the drop down menu to select a specific property. When you do that, experimental and predicted properties are shown in more detail in separate tables. You can also click the name of a property in the summary table to jump to the detailed data for that property.

For specific properties Experimental and Predicted values are displayed separately.
Available Chemical Properties
Boiling Point
The boiling point of a substance is the temperature at which the vapor pressure of a liquid equals the pressure surrounding the liquid and the liquid changes into a vapor (Source: Wikipedia).
Melting Point
The melting point (or, rarely, liquefaction point) of a substance is the temperature at which it changes state from solid to liquid. At the melting point the solid and liquid phase exist in equilibrium. The melting point of a substance depends on pressure and is usually specified at a standard pressure such as 1 atmosphere or 100 kPa (Source: Wikipedia).
Water Solubility
An aqueous solution is a solution in which the solvent is water. It is mostly shown in chemical equations by appending (aq) to the relevant chemical formula. For example, a solution of table salt, or sodium chloride (NaCl), in water would be represented as Na+(aq) + Cl−(aq) (Source: Wikipedia).
Henry’s Law
In physical chemistry, Henry’s law is a gas law that states that the amount of dissolved gas in a liquid is proportional to its partial pressure above the liquid. The proportionality factor is called Henry’s law constant. It was formulated by the English chemist William Henry, who studied the topic in the early 19th century (Source: Wikipedia).
Viscosity
The viscosity of a fluid is a measure of its resistance to deformation at a given rate. For liquids, it corresponds to the informal concept of “thickness”: for example, syrup has a higher viscosity than water, and syrup is thicker than water (Source: Wikipedia).
Polarizability
Polarizability usually refers to the tendency of matter, when subjected to an electric field, to acquire an electric dipole moment in proportion to that applied field. It is a property of all matter, inasmuch as matter is made up of elementary particles which have an electric charge, namely protons and electrons. When subject to an electric field, the negatively charged electrons and positively charged atomic nuclei are subject to opposite forces and undergo charge separation (Source: Wikipedia).
Density
The density (more precisely, the volumetric mass density; also known as specific mass), of a substance is its mass per unit volume (Source: Wikipedia).
Flash Point
In chemistry, the flash point of a volatile material is the lowest temperature at which its vapors ignite if given an ignition source. The flash point is sometimes confused with the autoignition temperature, the temperature that causes spontaneous ignition (Source: Wikipedia).
Molar Volume
In chemistry and related fields, the molar volume of a substance is the occupied volume divided by the amount of substance at a given temperature and pressure. It is equal to the molar mass divided by the mass density (Source: Wikipedia).
Log-KoA: Octanol-Air
Coefficient of the partitioning of the chemical between octanol (an organic solvent) and air.
Log-KoW: Octanol-Water
Coefficient of the partitioning of the chemical between octanol (an organic solvent) and water.
LogD4.5
“logD is the distribution coefficient that takes into account the pH. This constant is therefore used to estimate the different relative concentrations of the ionized and non-ionized forms of a chemical at a given pH.” In this case the pH is 4.5. (source: Mansouri et. al. J Cheminform 11, 50 (2019))
LogD5.5
“logD is the distribution coefficient that takes into account the pH. This constant is therefore used to estimate the different relative concentrations of the ionized and non-ionized forms of a chemical at a given pH.” In this case the pH is 5.5. (source: Mansouri et. al. J Cheminform 11, 50 (2019))
Molar Refractivity
Molar refractivity, is a measure of the total polarizability of a mole of a substance and is dependent on the temperature, the index of refraction, and the pressure (Source: Wikipedia).
pKa Acidic Apparent
This value could be acidic or basic. Not every chemical has an acidic or basic center, so for some substances, there might not be a value.
Vapor Pressure
Vapor pressure or equilibrium vapor pressure is defined as the pressure exerted by a vapor in thermodynamic equilibrium with its condensed phases (solid or liquid) at a given temperature in a closed system (Source: Wikipedia).
Surface Tension
Surface tension is the tendency of liquid surfaces at rest to shrink into the minimum surface area possible. Surface tension is what allows objects with a higher density than water such as razor blades and insects (e.g. water striders) to float on a water surface without becoming even partly submerged (Source: Wikipedia).
Index of Refraction
In optics, the refractive index (also known as refraction index or index of refraction) of a material is a dimensionless number that describes how fast light travels through the material (Source: Wikipedia).
Thermal Conductivity
The thermal conductivity of a material is a measure of its ability to conduct heat. Heat transfer occurs at a lower rate in materials of low thermal conductivity than in materials of high thermal conductivity (Source: Wikipedia).
Environmental Fate and Transport
The Environmental Fate and Transport tab provides information about the behavior of the selected chemical in the environment, both in terms of how it is accumulated and transformed by organisms, and how it interacts with soil and air. Both experimental (measured in a laboratory) and predicted (by mathematical models) values are available.
Navigating Environmental Fate/Transport Tab
Just like Physchem Properties, the Environmental Fate and Transport tab starts with a summary view that combines experimental and predicted values, and has a drop down menu that lets the user view detailed information about different categories of Fate and Transport data, with separate tables for experimental (measured) and predicted (modelled) results. See Physchem Properties for a notes on switching between categories.
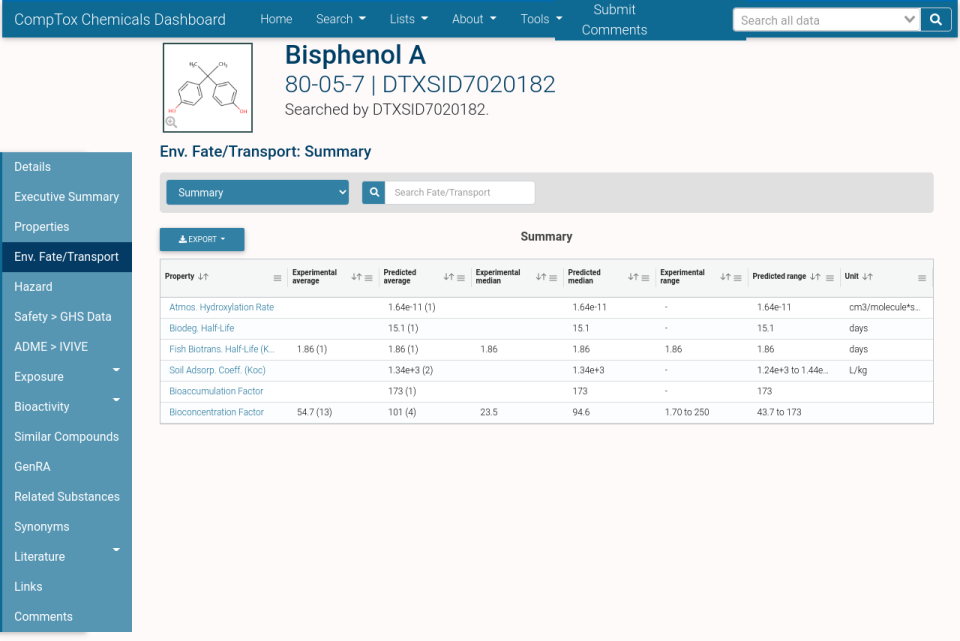
Underlined data source and model names in the Source columns can be hovered over for more information. Some Calculation Details and QMRF (QSAR Model Reporting Format) links open new pages or PDF reports. Regular export options are available but only download the visible content of the tables, not the reports available by following links.
Available Environmental Fate/Transport Categories
Bioaccumulation factor
Bioaccumulation is the gradual accumulation of substances, such as pesticides or other chemicals, in an organism.[1] Bioaccumulation occurs when an organism absorbs a substance at a rate faster than that at which the substance is lost or eliminated by catabolism and excretion - Wikipedia. For more detailed information, please refer to this EPA report.
Bioconcentration factor
Bioconcentration is a measure of the amount of pesticide residue in an organism’s tissue relative to the concentration in the organism’s environment. Bioconcentration factors (BCFs) are calculated by considering pesticide tissue concentrations with respect to environmental pesticide concentrations. For more information on the description of equations used to calculate the BCF, please refer to this EPA document.
Soil absorption coefficient (Koc)
Processes which influence the behavior of contaminants in the subsurface must be considered both in evaluating the potential for movement as well as in designing remediation activities at hazardous waste sites. Such factors not only tend to regulate the mobility of contaminants, but also their form and stability. Sorption is often the paramount process controlling the behavior of contaminants in the subsurface. More information can be found in this EPA report.
Biodegradation half-life
The rate of transformation of pesticides in the environment is commonly described using first-order kinetics, often referred to as single first-order (SFO). The first-order representation is convenient because the rate is summarized with a single parameter (the rate constant, k), and the rate of transformation is independent of the initial concentration. The half-life, t1/2 =ln(2)/k, indicates the time required to reduce the concentration by 50% from any concentration point in time. It is an intuitive way to express the rate of decline of a first-order degradation. For more information, please refer to this EPA guidance on calculating representative half-live values and characterizing pesticide degradation.
Atmospheric hydroxylation rate
The atmospheric hydroxylation rate (LogOH) is the OH rate constant for the atmospheric, gas-phase reaction between photochemically produced hydroxyl radicals and organic chemicals. More information can be found in this EPA publication.
Fish biotransformation half-life (Km)
Bioaccumulation in fish is a function of competing rates of chemical uptake and elimination. For hydrophobic organic chemicals bioconcentration, bioaccumulation and biomagnification potential are high and the biotransformation rate constant is a key parameter. More information on this parameter can be found in this EPA publication.
Hazard
The Hazard tab displays various types of toxicity data, including publicly available toxicity dose–effect related summary values typically used in risk assessments, that are aggregated into the ToxVal database and integrated into the Dashboard. ToxValDB contains three main categories of data relevant to human health assessment: 1) Results from in vivo toxicity experiments (e.g., No Observed Adverse Effect Level (NOAEL), Benchmark Dose Lower Bound (BMDL)), 2) Risk assessment values (e.g., Reference Doses (RfDs), Minimal Risk Levels (MRLs)) from authoritative sources, and (3) Media exposure guidelines (e.g., Maximum Contaminant Levels (MCLs), Acute Exposure Guideline Levels (AEGLs)) from authoritative sources. Species are limited to those commonly used in human health assessment. For ecology-relevant data, please refer to the ECOTOX Knowledge Base.
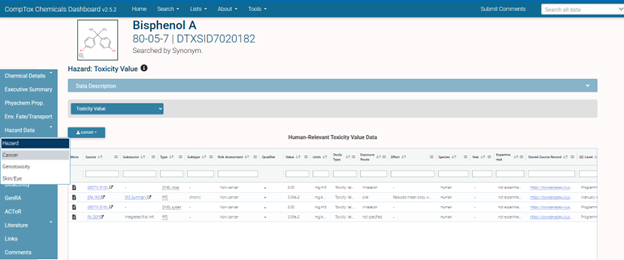
Hazard table for Toxicity Value
Navigating the Hazard Tab
Properties and Env. Fate and Transport initially present a summary view of experimental and predicted data, with the option to view individual categories in more detail with experimental and predicted observations separated. Hazard has a different layout - there is no summary view as such, just separate views for each category of Hazard data.

The category selection drop-down.
Available Hazard Categories
Category availability varies by chemical:
- Acute Exposure Guidelines
- Dose Response Summary Value
- Media Exposure Guidelines
- Mortality Response Summary Value
- Toxicity Value
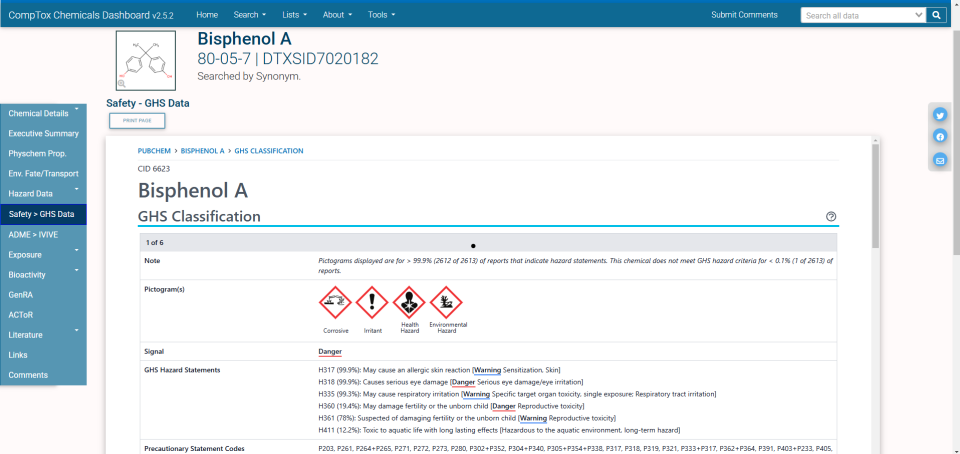
Safety
The Safety tab shows Globally Harmonized System (GHS) information directly from PubChem.
ADME>IVIVE
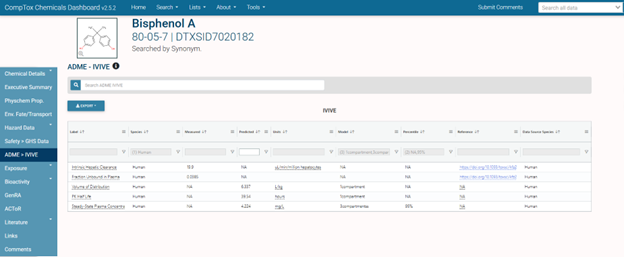
The ADME (Absorption, Distribution, Metabolism, Excretion) tab provides In-vitro to in-vivo extrapolation (IVIVE) information. Available parameters are listed here - hovering on an underlined cell in the table in the Dashboard displays the descriptions below. Note that the image below is the default view, and the table pre-filters the visible information on the Human, Percent, and Model columns. The filter icon is visible on these columns. Note that human and rat data are available for these parameters.
Intrinsic Hepatic Clearance
Intrinsic hepatic clearance characterizes the volume of blood cleared by the metabolism of a million hepatocytes. This value can be scaled to predict in vivo clearance using the cellular density of, volume of, and blood flow to the liver. When there is a value in the “Measured” column, it is the rate of chemical clearance measured in vitro using hepatocytes. When the value is in the “Predicted” column, it is predicted using QSAR models.
Fraction Unbound in Human Plasma
Fraction of chemical present in the soluble portion of the plasma, not bound to plasma proteins. Within the Dashboard, both measured and predicted values are available for several chemicals.
Volume of Distribution
The apparent volume (L/kg) required to account for all of the chemical in the body if the concentration in all of the tissues is the same as the plasma concentration. This parameter is an indicator of the extent of chemical distribution into body fluids and tissues. The computed values are generated with the HTTK R-package.
Days to Steady State
Number of days of chemical exposure, given an assumed exposure scenario, required to reach the point where the chemical intake is in the dynamic equilibrium with its elimination. This in effect will result in a systematic concentration that is relatively unchanged over time. The computed values are generated with the HTTK R-package.
Pharmaco-Kinetic (PK) Half Life
The length of time required for a plasma chemical concentration to decrease by half, if there is no additional exposure. The computed values are generated with the HTTK R-package.
Steady-State Plasma Concentration
The computed values are generated with the HTTK R-package.
The plasma concentration achieved when the chemical intake is in dynamic equilibrium with its elimination for the model indicated by column “Model”, currently 3compartmentss (steady state) and Physiologically Based Toxicokinetic (PBTK) model. The value reported is calculated assuming a 1 mg/kg/day rate of exposure. A distribution is calculated characterizing population variability and uncertainty -- the column “Percentile” indicates from where in the distribution this value is drawn, currently providing values for 50% and 95%. The value can be scaled linearly to estimate a steady-state plasma concentration at any given dose for the species indicated by column “Species”, currently rat and human.
Exposure
The Exposure sub-tabs provide several tables of exposure related information.
Product & Use Categories
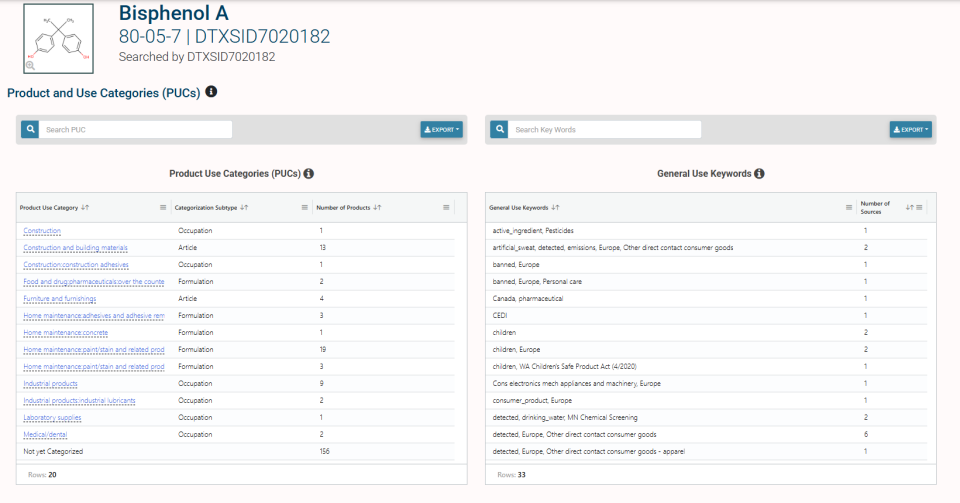
Tables of product use and general keyword data for the chemical selected in the Dashboard. Product use / keyword hyperlinks on the text in the tables refer to lists of all the chemicals in the Dashboard with the respective product use or general keyword. For more information on the product use categories, please refer to K. Isaacs et al., 2019, Journal of Exposure Science & Environmental Epidemiology. For more information on the general use keywords, please refer to K. L. Dionisio et. al., 2015, Toxicology Reports. Please note the general use keywords presented here are an updated version of the CPCat terms and cassettes presented in the paper; however application and interpretation of keywords/terms remains the same.
Chemical Weight Fractions
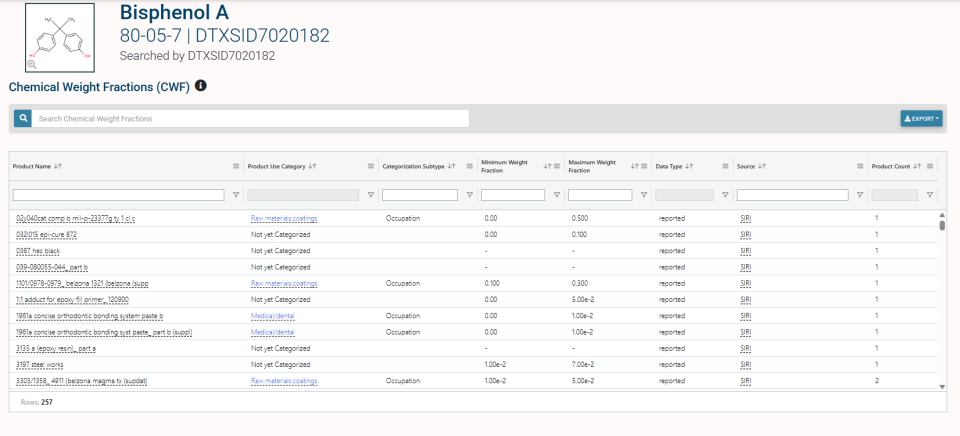
The chemical weight fraction is the fraction of a product’s weight contributed by the selected chemical. The following papers are recommended reading. Regarding the construction of the data set, K Dionisio et al 2018, Scientific Data. Regarding the Product Use Categories, K. Isaacs et al, 2019, Journal of Exposure Science & Environmental Epidemiology.
Chemical Functional Use
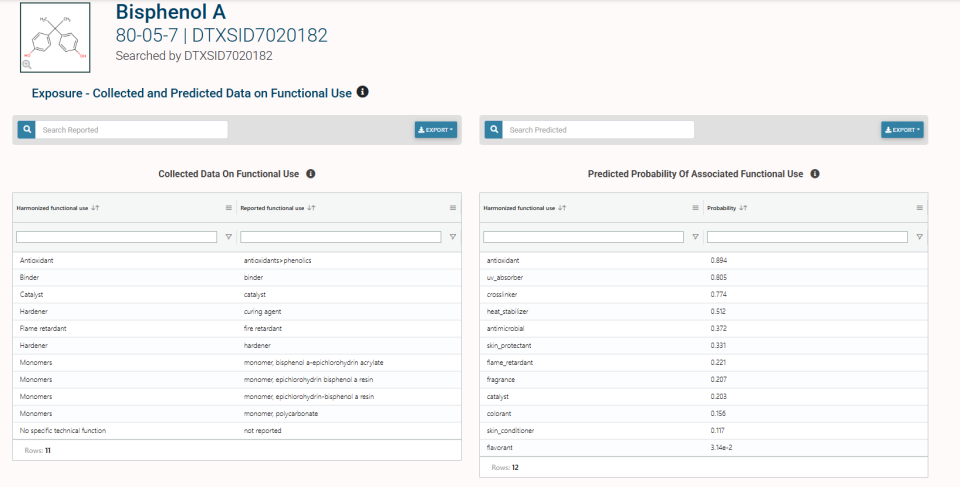
Recorded and predicted probability of functional use for the selected chemical are provided in the two tables in this spreadsheet. Regarding the Collected Data on Functional Use, the following papers are recommended reading in regards to the Collected Data on Functional Use table: K Isaacs et al, 2016, Toxicology Reports and K Phillips et al 2017, Green Chemistry (recommended reading also for the Predicted Probability of Associated Functional Use table). Reported functions have been mapped to categories defined in the OECD report “Internationally Harmonised Functional, Product, and Article Use Categories". Additional categories (denoted with “EPA”) have been developed by EPA Office of Research and Development for use in its Chemicals and Products Database (CPDat). Current and future releases of CPDat (including detailed functional use data) can be found at https://doi.org/10.23645/epacomptox.5352997 .
Toxics Release Inventory
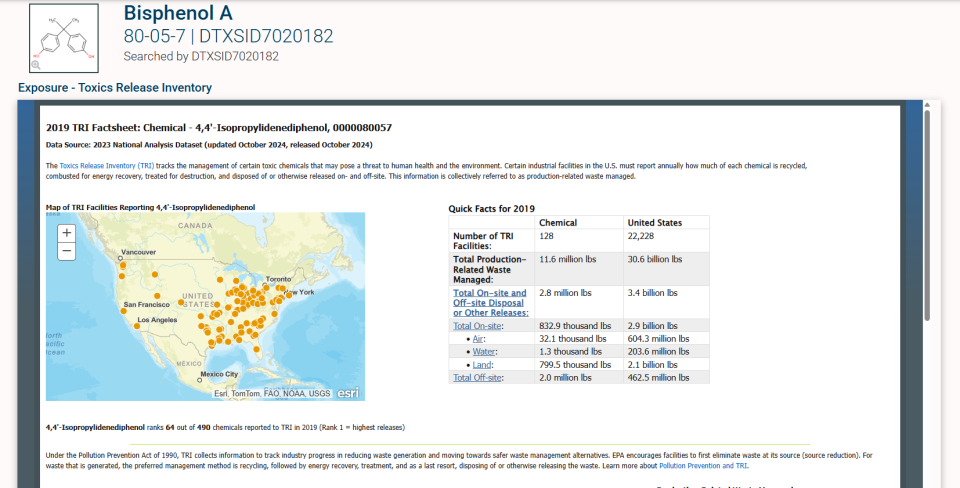
This sub-tab links directly to an external source, the US EPA’s Toxics Release Inventory (TRI). As it is an external source subject to change data may not always be available.
Biomonitoring Data

The Centers for Disease Control (CDC) National Health and Nutrition Examination Survey (NHANES) is a program of studies designed to assess the health and nutritional status of adults and children in the United States. As part of the NHANES, the CDC monitors biomarkers of chemical exposure (chiefly metabolites) in the blood and urine to quantify the levels of chemical compounds present in U.S. residents. Each two-year study cycle comprises approximately 10,000 individuals, with exposure biomarker data for any given chemical available from only a subset of roughly 1/3 of the individuals in the study. In the 2014 publication “High Throughput Heuristics for Prioritizing Human Exposure to Environmental Chemicals” EPA scientists inferred steady state exposure rates (mg/kg bodyweight) for 106 chemicals from the NHANES urine samples. This figure is an example of the information available for one of those 106 chemicals.
Exposure Predictions
The demographic exposure predictions are estimates of the average (geometric mean) exposure rate (mg/kg bodyweight/day) for the U.S. population. We are 50% confident that the exposure for the chemical is below the median estimate, and we are 95% confident that the average exposure rate is below the upper 95th percent estimate. Note that the “Total” is not the sum of the predictions, but is the total population prediction based upon the consensus exposure model prediction and the similarity of the compound to those chemicals monitored by NHANES. The method for the total U.S. population was described in a 2018 publication, “Consensus Modeling of Median Chemical Intake for the U.S. Population Based on Predictions of Exposure Pathways”. When available, demographic-specific predictions are based upon a simpler, heuristic model described in the 2014 publication “High Throughput Heuristics for Prioritizing Human Exposure to Environmental Chemicals”.

By default, the table shows only the Systematic Empirical Evaluation of Models (SEEM) 2 Heuristic and SEEM3 Consensus models; however additional models such as FINE, food contact, RAIDAR, Stochastic Human Exposure and Dose Simulation (SHEDS) (direct/indirect), and USETox (diet/indust/pest/res) are available by selecting them in the Predictor column. Note that some columns are filtered from the default view (e.g., Lower 95%ile, Applicability Domain, and Reference), which can be selected using the table features.
The General Predictions Data table provides predictions for production volume, presence/absence on the Stockholm Convention list, and probability of type of exposure (e.g., far-field pesticide, industrial, residential, dietary).
Production Volume
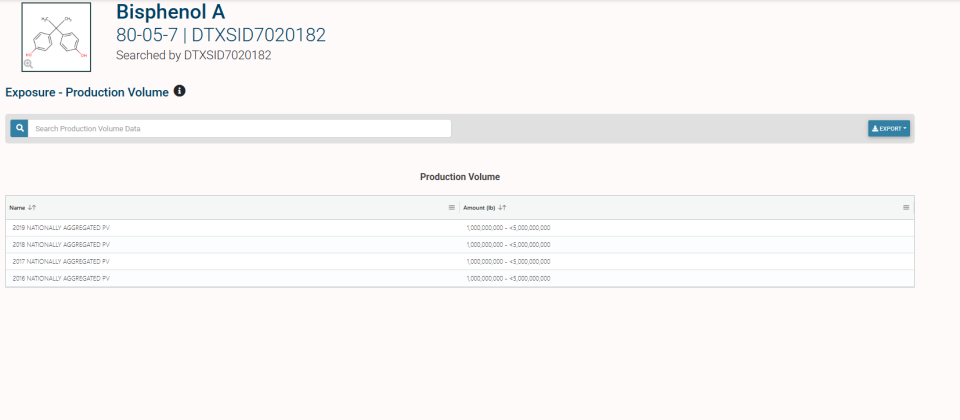
The Production Volume data is sourced from the Chemical Data Reporting (CDR) data submitted to US-EPA. The Chemical Data Reporting (CDR) Rule, issued under the Toxic Substances Control Act (TSCA), requires manufacturers (including importers) to give EPA information on the chemicals they produce domestically or import into the United States. EPA uses the data to help assess the potential human health and environmental effects of these chemicals and makes the non-confidential business information it receives available to the public.
Bioactivity
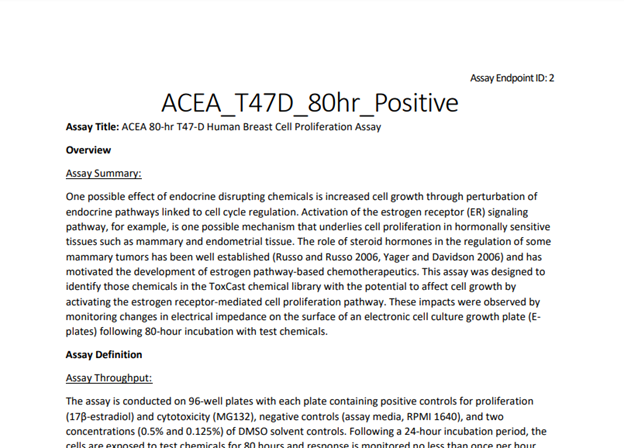
EPA researchers use rapid chemical screening (called high-throughput screening assays) to quickly and efficiently test thousands of chemicals. These data (including those from the ToxCast and Tox21 programs) are contained in the InvitroDB database. EPA’s Toxicity Forecaster (ToxCast) is a collection of bioactivity screening data from heterogeneous assay platforms for thousands of chemicals of interest to the EPA. ToxCast is a multi-year effort launched in 2007 that uses a growing list of medium and high throughput in vitro screening assays to expose living cells, isolated proteins, or other biological molecules to chemicals. The cells or proteins are then screened for changes in biological activity that may suggest potential toxic effects. Learn more about the ToxCast program.
ToxCast: Summary
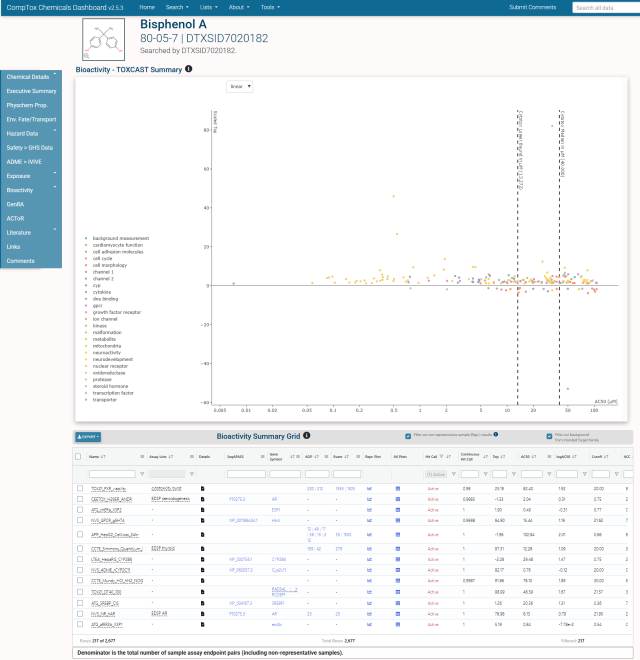
The bioassay data displayed in this panel includes modeled AC50 values from multi-concentration data only.
Note: Single concentration data may also be available for some assay technologies, which can be found on the Dashboard through the List of Assays tab. Single concentration data are included in the list of ‘tested’ assays endpoints if multi-concentration data are unavailable. Raw, normalized, and interpreted single concentration data from level 0 to level 2 are fully available from the freely downloadable MySQL database, invitrodb. Level 0 is the raw data from the vendor, level 1 takes the raw values and normalizes them to either the percentage of a control or to fold-change from baseline, and level 2 processing defines the baseline median absolute deviation (bmad), collapses any replicates by sample ID, and determines the activity.
The ToxCast: Summary sub-tab renders a summary plot of assay results for common assay targets. Some useful information about the values may provide useful context for interpreting ToxCast results. Specifically,
- Hovering the mouse over points on the plot provides more information, some points include a link to a report accessible by clicking.
- A drop-down menu at the top of the plot switches between linear and log scale.
- The cytotoxicity median and lower bound estimates are based on as many as 88 assay endpoints in invitrodb including multiple cell lines and technologies and represent an estimated concentration for general cytotoxicity across assays.
- The plot shows a scaled response, which is calculated by dividing the response values by the activity cutoff thereby enabling response comparisons across assay endpoints. This scaled top is a way of plotting heterogeneous assay data with different y-axis units on the same summary plot.
Below the plot is a table of summary and concentration-response data. The table loads with three filters applied:
- Filter out non-representative sample (Repr.) results - A single chemical may have been tested as multiple samples in an assay, and representative sample is determined using the ToxCast Pipeline function tcplSubsetChid().
- Filter out ‘background’ from the Intended Target Family column. With this filter applied only non-background assays (e.g., cell cycle, nuclear receptor, neurodevelopment, etc.) will be shown on default
- Filter showing Active responses
The filters may be unapplied by de-selecting the check boxes, or in the case of the Active responses, inactive responses can be added by clicking on the filter icon in the Hit Call column and checking “Select All”.
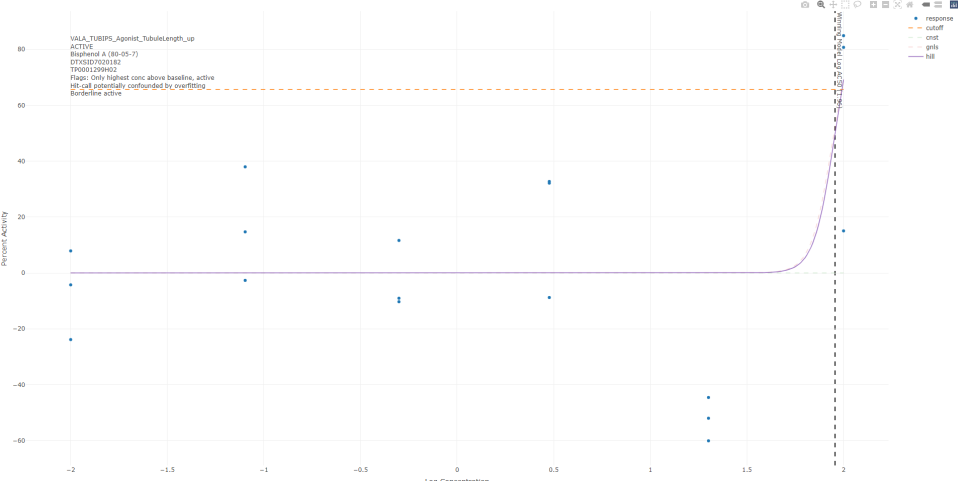
Note that the Top is different than the scaled top mentioned below. The Top is calculated as the top of the winning curve when the dose-response data is fit to the winning model. The winning model refers to which model best fit the data (e.g., hill-model), and the winning curve is the fit of the data using that model. The data and model fits can be seen in the ToxCast Conc. Response Data sub-tab.
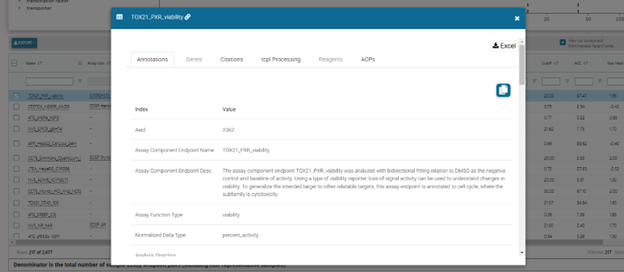
Hovering on the underlined assay names in the Name column shows a short description of the assay.
The document icons in the Details column link to more detailed, downloadable, descriptions of the assays.
Clicking on some text in the cells will enable downloading of additional data or visualization of plot data. Examples include:
- SeqAPASS column – Sequence Alignment to Predict Across Species Susceptibility (SeqAPASS) allows one to download data to extrapolate toxicity information across species. For more information on SeqAPASS: https://www.epa.gov/comptox-tools/sequence-alignment-predict-across-species-susceptibility-seqapass-resource-hub
- Gene Symbol column – The invitroDB database links assays with relevant genes. Clicking on the gene symbol links out to the National Library of Medicine (NLM) National Center for Biotechnology Information (NCBI) gene page.
- AOP and Event columns – Adverse Outcome Pathways (AOPs) are linked to the ToxCast Assays by Key Events. The number(s) in the AOP column link out to the AOP, and the number(s) in the Event column link out to the Key Event, both on the AOP-Wiki page.
- Rep. Plot (representative plot) column - opens a plot of the representative result for the chemical-assay pair in a new tab. This downloadable plot allows users to see how the representative sample data is fit to the curve-fit models
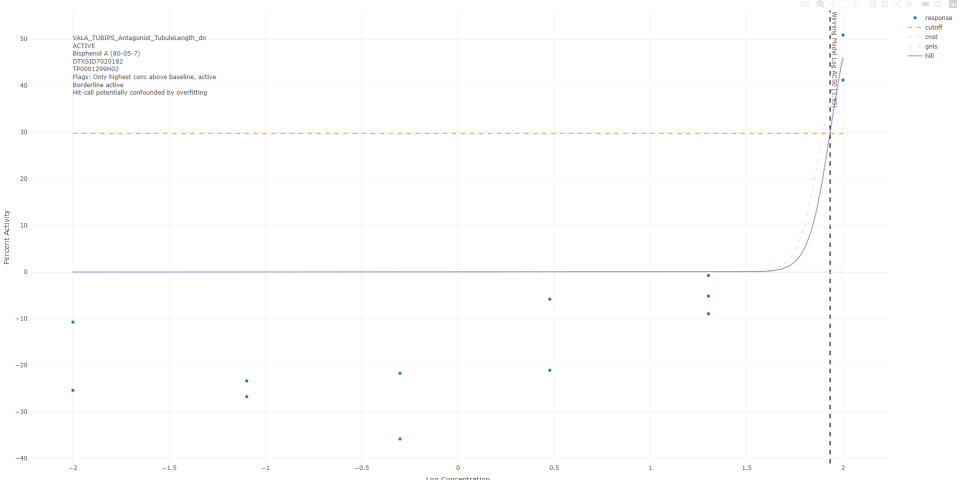
- All Plots column - opens all of the sample data plots for the assay in a new tab.
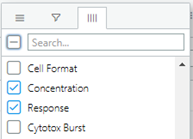
Since the invitroDB dataset is large, many columns are hidden by default, but available when exporting the data, or by enabling visualization of the column from any visible column with the three horizontal lines.
For example:

Notable hidden columns include:
Concentration and Response columns: These columns allow the users to see the concentration and response data points (x,y) , where the data are separated using the double pipe (“||”) symbol.
- Description column – provides a pdf link to the assay description, including protocol information and performance, where available. Example below:
High-Throughput Transcriptomics (HTTr): Summary
The HTTr sub-tab provides access to data for observed changes in gene expression in cells following chemical exposure. The plot displays benchmark dose (BMD) values from active signatures from super targets (e.g., genes, gene families, or higher order biological processes). Below the plot is a table of HTTr data that provides details on the data sets, which can be downloaded using the blue Export button.

Hovering the mouse over data points (one dot per signature or gene set) on the plot provides more information (e.g., cell type, target level, BMD, etc.)
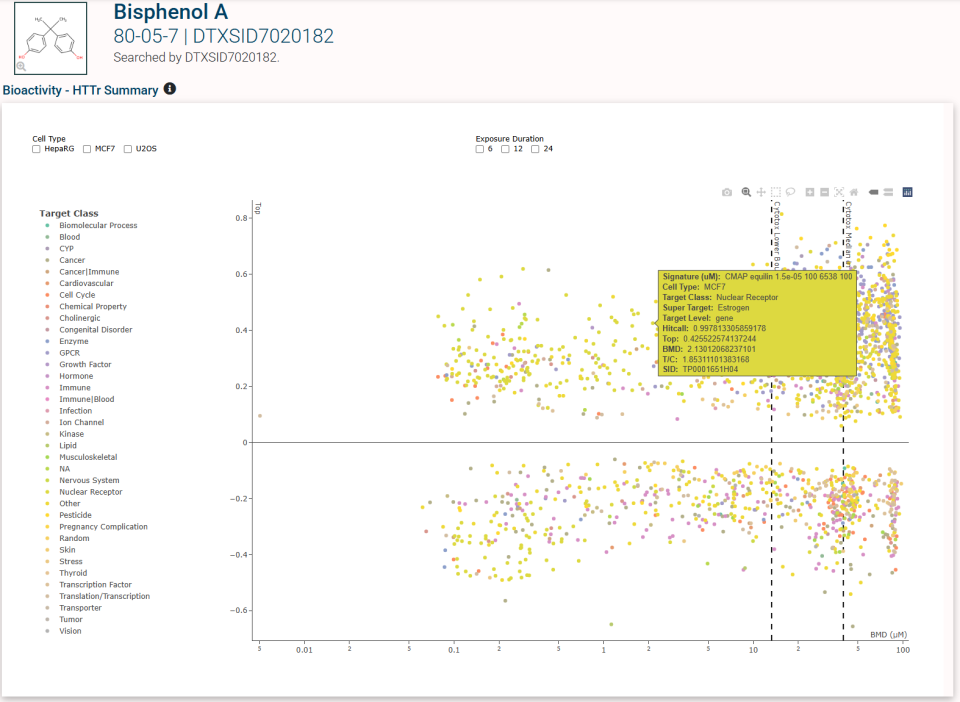
Double click on the legends (e.g., Cancer) next to x-axis isolates one trace. Double click on the same legend reverts the plot back to full screen where all the legends are plotted.
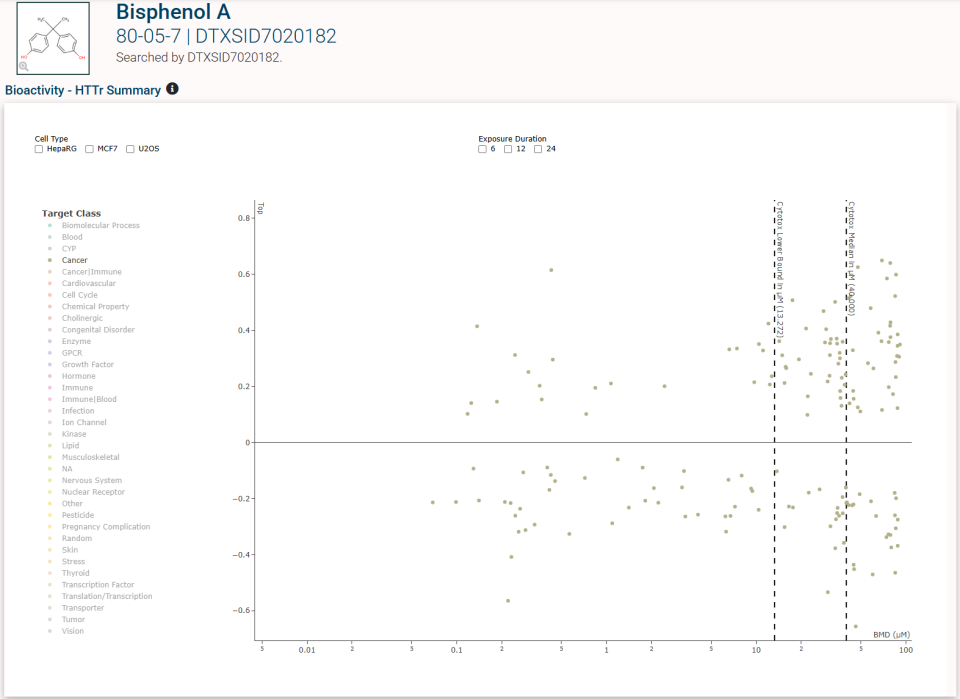
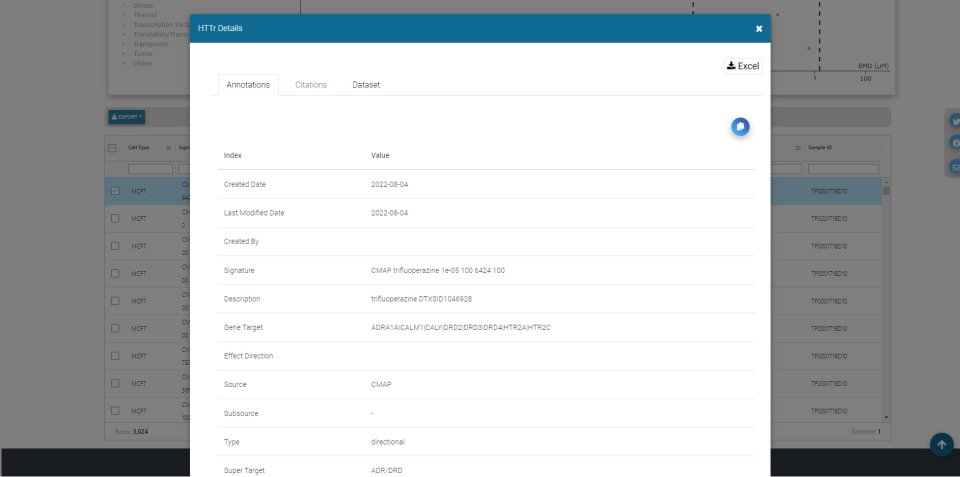
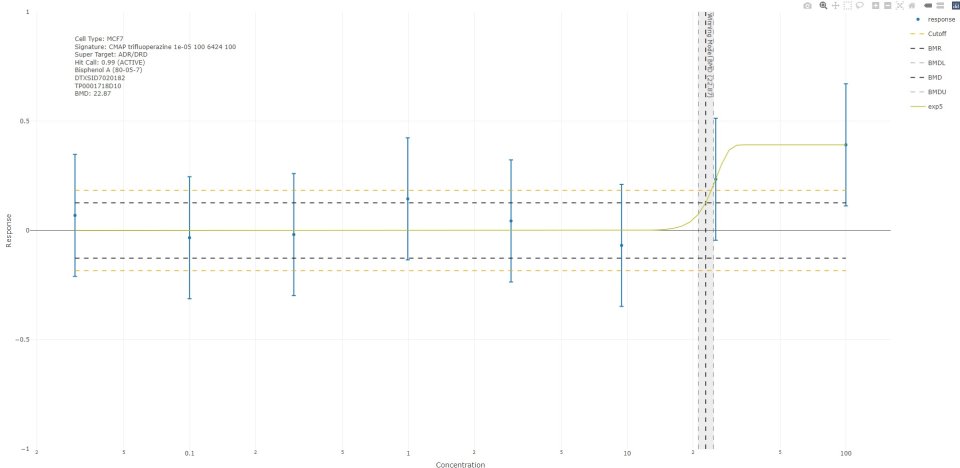
Downloadable HTTr details (including annotation and data set) and plots for each signature can be found in the Details and Plot columns, respectively.

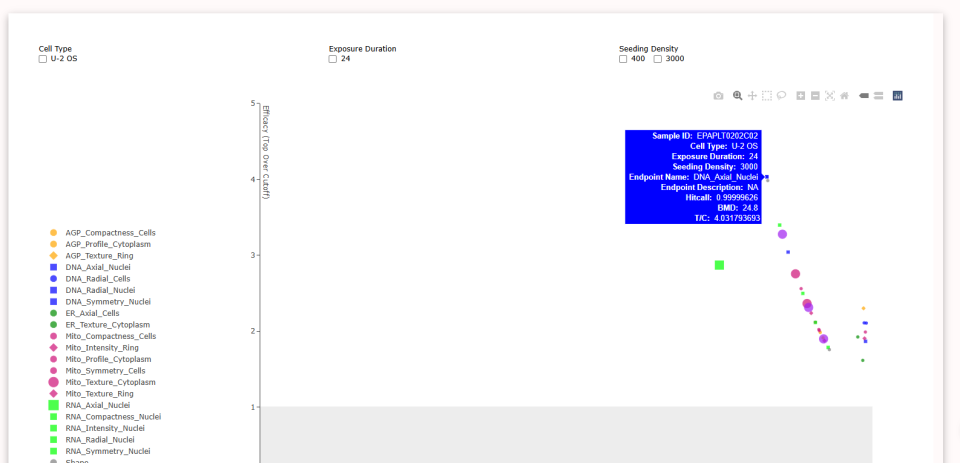
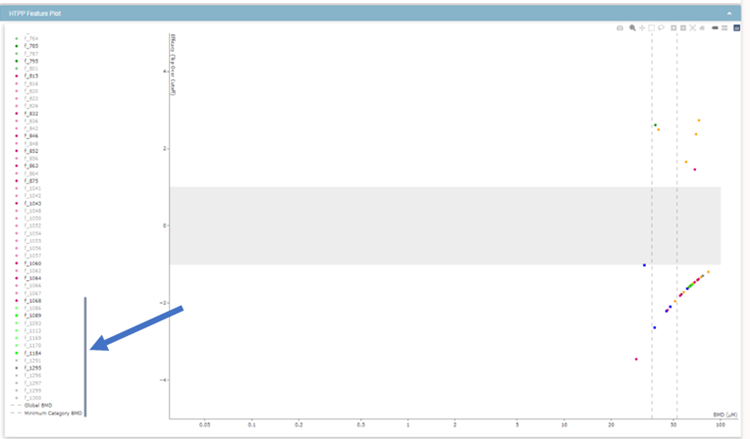
High-Throughput Phenotypic Profiling (HTPP): Summary
The HTPP sub-tab provides access to data for bioactivity screening of chemicals in concentration-response using the cell painting assay to profile chemical effects on cell morphology, which could aid in the identification of chemicals with similar mechanisms of action. The HTPP Category Plot displays global (up to 1 active endpoint) and category-level (up to 49 active endpoints) modeling of HTPP data. An example of a category-level endpoint is Mito_Texture_Cytoplasm, a latent variable measuring the texture of mitochondrial labeling in the cytoplasm compartment of the cells. The HTPP Feature Plot displays feature-level (up to 1300 active endpoints) modelling of HTPP data. Below the plots is a table of HTPP data that provides details (e.g., endpoint, concentration, and response) on the data sets, which can be downloaded using the blue Export button.
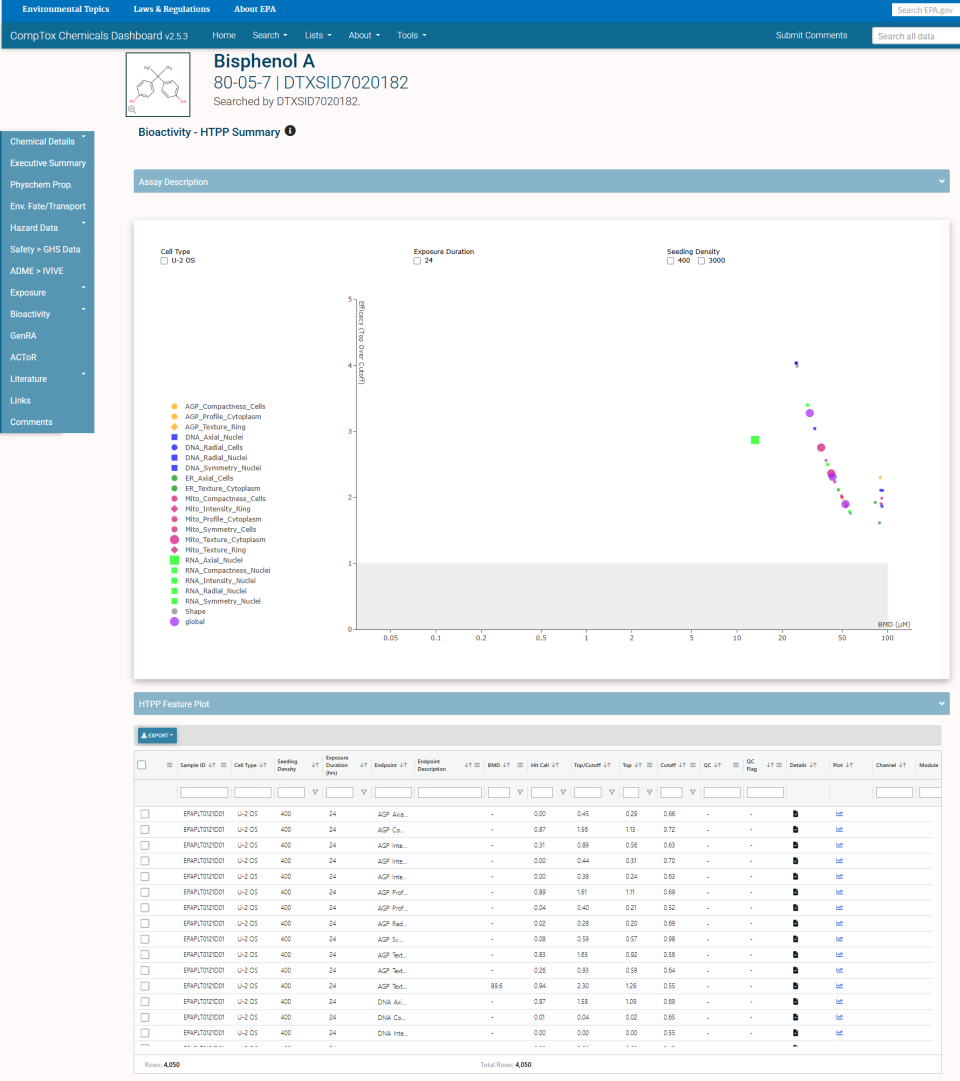
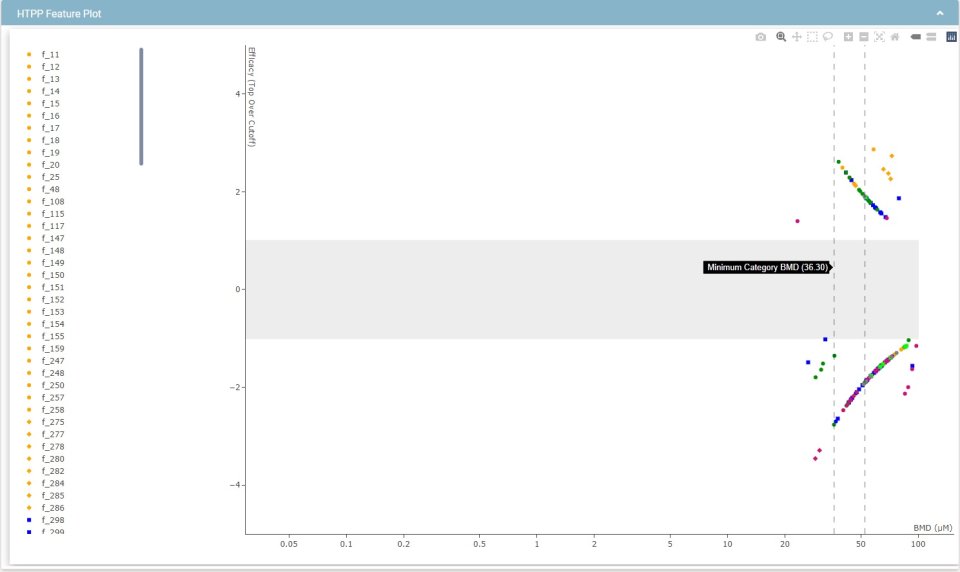
Hovering the mouse over dots (one dot per trace) on the plot provides more information (e.g., sample ID [SID], Endpoint, Hitcall, benchmark dose [BMD], etc.).
Double-clicking on the legends (e.g., f_546) next to x-axis on plots isolates one trace. Double-clicking on the same legend reverts the plot back to full screen where all the legends are plotted.
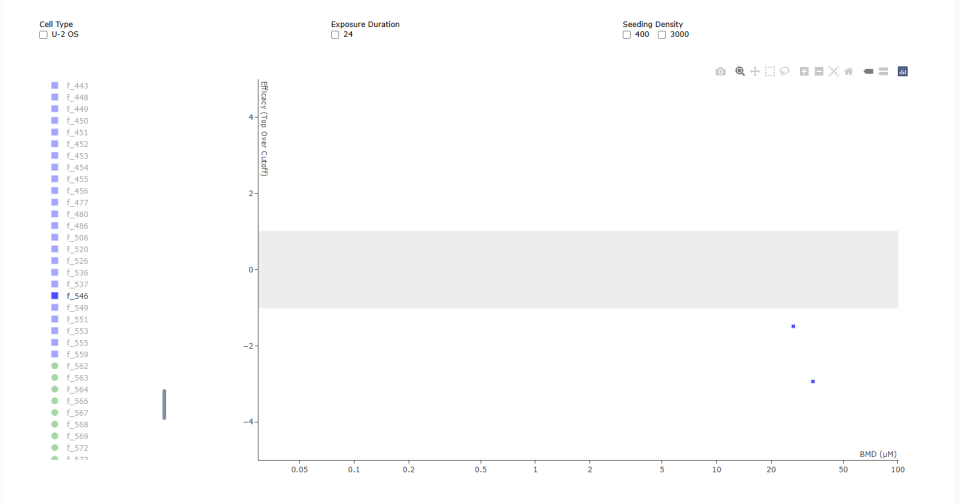
Clicking on the legends next to x-axis removes the selected trace from the plot. Multiple traces could be selected and isolated. Deselected legends will gray out. The scroll-down function can be used to review and select all the legends next to x-axis.
Downloadable HTTP details (including annotation and data set) and plots for each signature can be found in the Details and Plot columns, respectively.

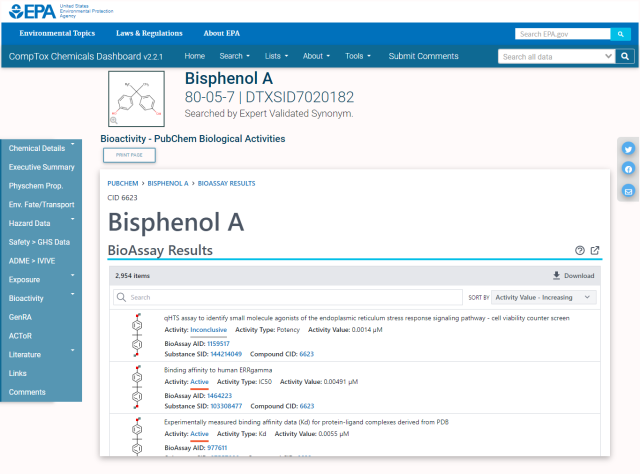
PubChem
The PubChem sub-tab links directly to the PubChem page for assays for the selected chemical, links open in a new window on the PubChem site.
PubChem
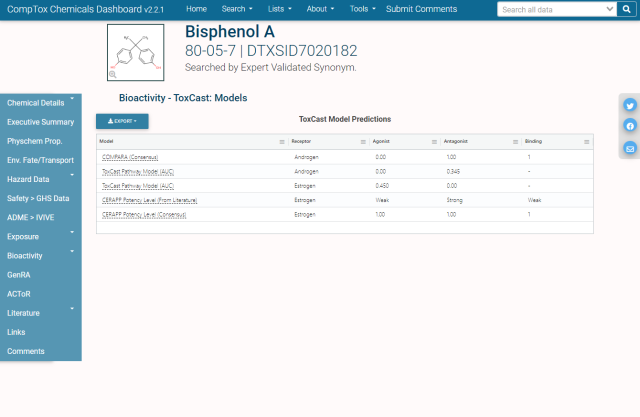
ToxCast Models
The ToxCast Models sub-tab lists ToxCast model predictions, hovering on the model name in the model column provides more information on the model.
ToxCast Models
GenRA
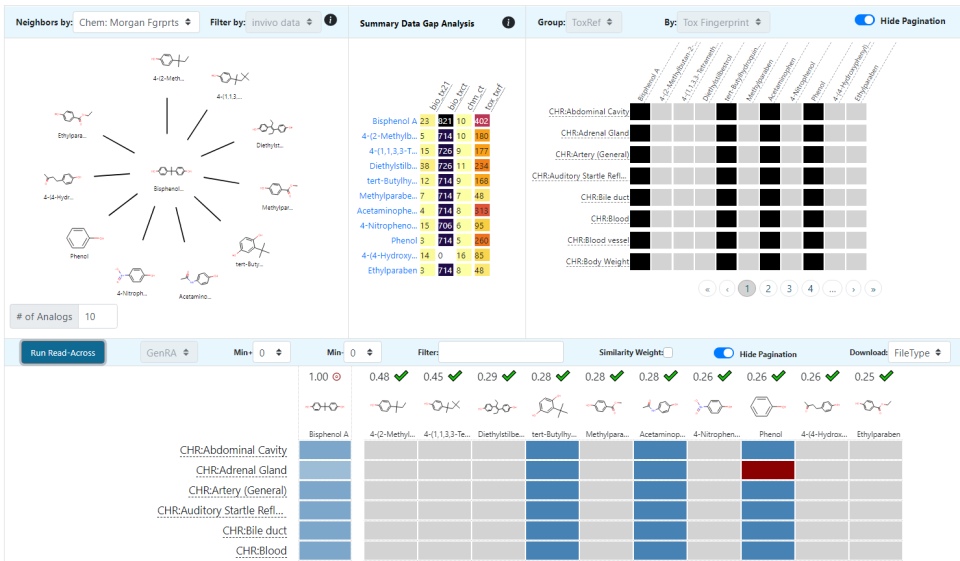
The GenRA (Generalized Read Across) tab links to a separate tool which opens in a new tab.
GenRA provides a means to identify potential source analogues for a given target chemical, the center of the radial plot (below). The radial plot displays K source analogues (otherwise called nearest neighbors) where K can be set from 1 to 15. Analogues can be filtered based on the availability of in vivo toxicity data. Analogues are ordered in decreasing order of similarity in a clockwise manner in the plot, starting with the most similar at the top. The similarity indices are annotated c (chemistry), b (bioactivity), or t (toxicity) depending on the similarity context selected. Analogues may be identified using chemical descriptors or bioactivity descriptors. There are 3 different types of chemical descriptors included that are fingerprint representations of chemical structure - Morgan fingerprints, torsion fingerprints and chemotypes. Bioactivity descriptors make reference to a fingerprint representation of hit-calls from ToxCast or HTPP assays. For more details watch the video.
Literature
The Literature sub-tabs provide links to related literature searches.
Google Scholar
The Google Scholar sub-tab helps the user build a query for the Google Scholar service. The query expression starts with the name and CASRN of the chemical already in place. The user can add terms from drop down menus for some pre-defined topics and sub-topics. The query is updated to show these terms. The user can edit the query in the text box to use other terms before clicking submit to get results from Google Scholar.

Google Scholar query editor.
PubMed Abstract Sifter
The PubMed Abstract Sifter sub-tab helps the user build a query for the PubMed service. Note that this is a basic web application of PubMed Abstract Sifter. For the full downloadable version, please refer here: Downloadable Computational Toxicology Data
The basic version within the Dashboard uses a query expression that starts with the name and CASRN of the chemical already in place. The user can add terms from a drop-down menu for some pre-defined topics. The query is updated to show these terms. The user can edit the query in the text box to use other terms before clicking retrieve to get results from PubMed. Results are presented in a table which allows filtering and selection before export to CSV, Excel, or PubMed. Export to PubMed jumps to the PubMed site with a search for the selected articles.

A peer-reviewed journal article on the PubMed Abstract Sifter is located here: https://f1000research.com/articles/6-2164/v1, along with the Abstract Sifter Excel workbook, user documentation, and archived source code.
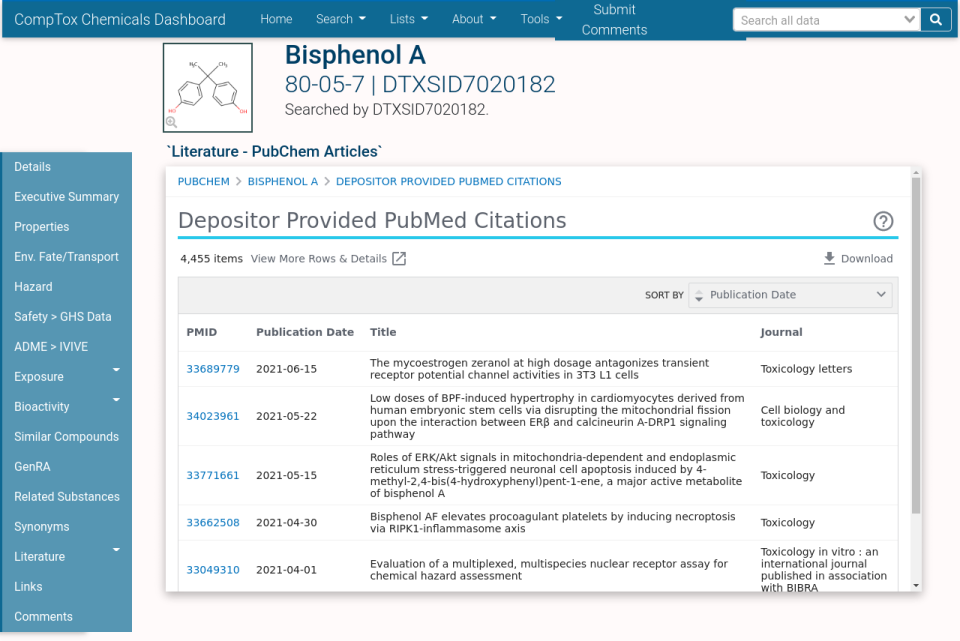
PubMed Articles
The PubMed Articles sub-tab links directly to the PubMed citations page for the chemical if available.
PubMed Articles
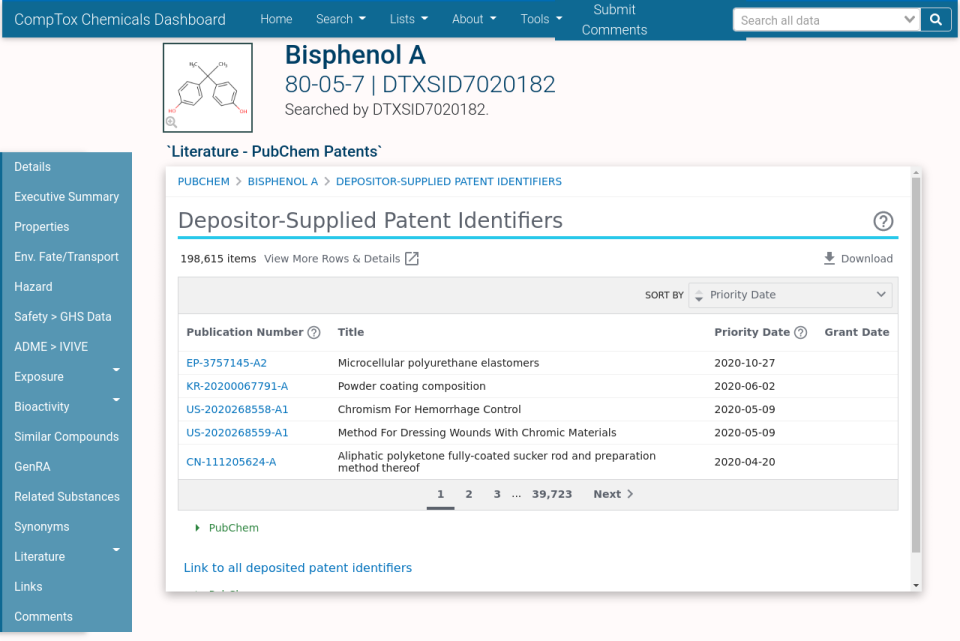
PubChem Patents
The PubMed Patents sub-tab links directly to the PubMed patents page for the chemical if available.
PubMed Articles
PPRTV
Provisional Peer-Reviewed Toxicity Values
There are less than 500 chemicals with PPRTV Reports in the Dashboard, the list can be found at https://comptox.epa.gov/dashboard/chemical-lists/PPRTVWEB. If a PPRTV report (PDF) for the selected chemical is available, it will be accessible on this sub-tab.
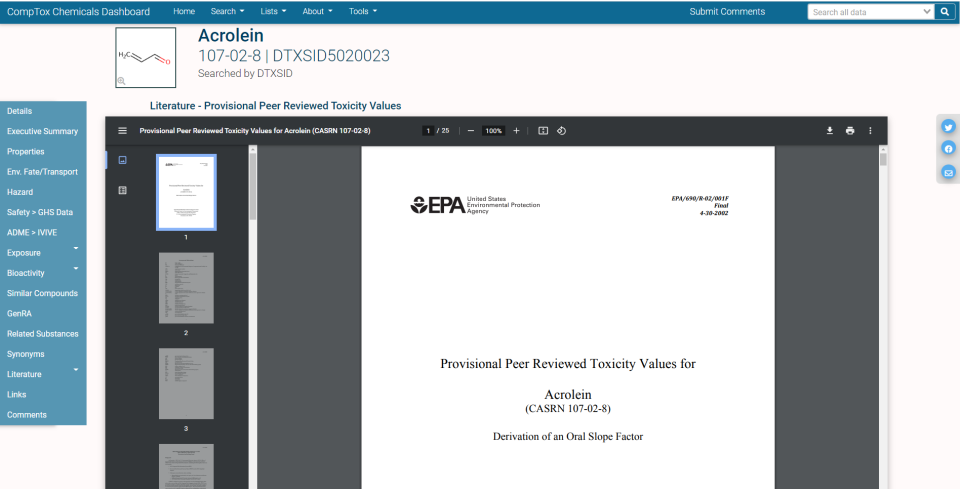
PPRTV Report
IRIS
The IRIS sub-tab links directly to the selected chemical’s page on EPA’s IRIS (Integrated Risk Information System) site, if available.
EPA HAWC
EPA HAWC is an interactive, expert-driven, content management system for human health assessments that is intended to promote transparency, data usability, and understanding of the data and decisions supporting an environmental and human health assessment. Specifically, EPA HAWC is an application that allows the data and decisions supporting an assessment to be evaluated and managed in modules (e.g., study evaluation, summary study data) that can then be publicly accessed online.
The EPA HAWC sub-tab links directly to the selected chemical’s page on EPA’s HAWC (Health Assessment Workspace Collaborative) site, if available.
Links
There is an abundance of information available for many of the chemicals contained within the CompTox Dashboard. In order to assist the user in navigating to these external links we have produced a click-through integration allowing the user to navigate directly to the site. Hovering over the names of the sources will display a tool tip with information about the specific resource. This approach is not exhaustive however and some of the links may not have data associated. We continue to invest in approaches to improve these external links. When there is no information for a particular chemical in a certain website, the link is not displayed.
Comments
The Comments tab (bottom of the left-hand tab list) displays the user-submitted comments related to the selected chemical. Both user’s comments and replies from appropriate experts can be seen.
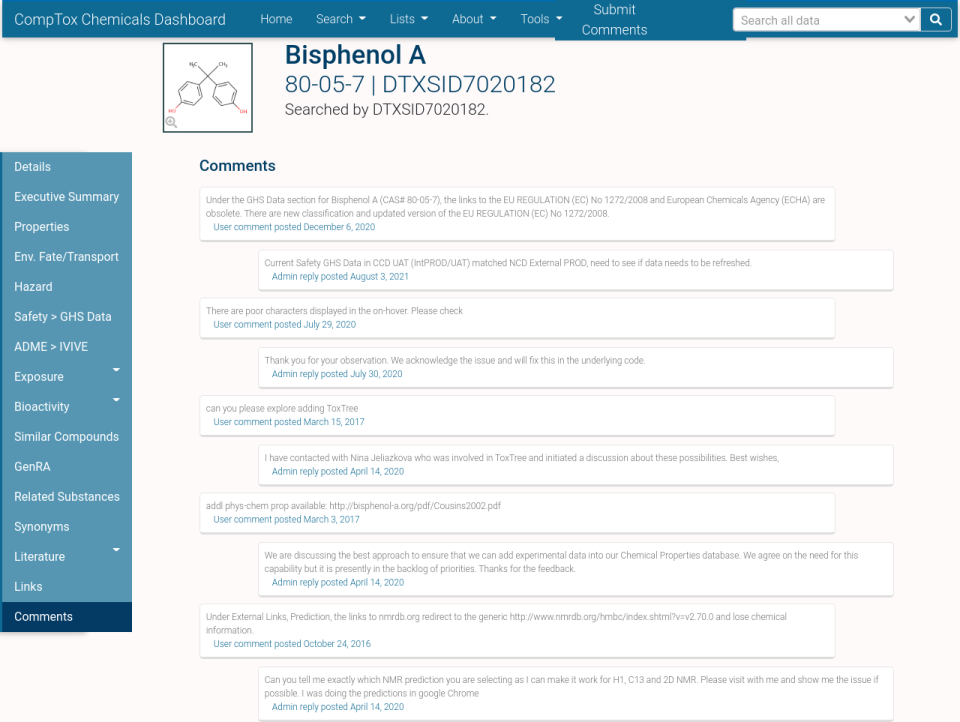
Comment page for BPA
Submitting comments
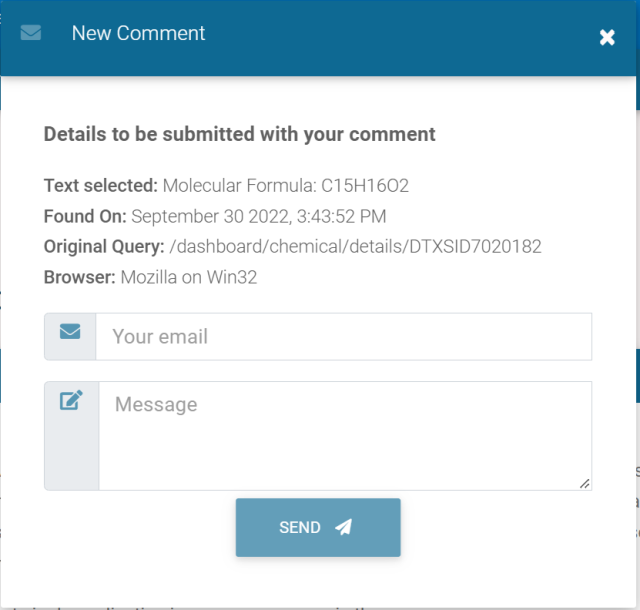
The Submit Comments link visible at the top of Dashboard pages allows users to make comments, ask questions, or submit feedback. Providing comments can be done in two ways. The first is by clicking the Submit Comments and providing your email address and feedback.


The second is by using the mouse to highlight a number, text, or other item within the Dashboard, then select the Submit Comments icon, and here you will see the information that you highlighted, as well as the webpage it was found on, and a field to add your email address and feedback.